Excimer laser systems used for corneal refractive surgery are 193 nm ultraviolet pulsed ablation platforms built around argon–fluoride (ArF) gas discharge tubes. From an engineering perspective, their clinical predictability depends on how tightly four variables are controlled over time: pulse energy, spatial energy distribution, spot positioning accuracy, and gas composition stability. Any drift in these parameters directly alters ablation depth geometry.
Physical Parameters of 193 nm ArF Excimer Ablation
All mainstream refractive excimer platforms operate at 193 nm (ArF), corresponding to photon energy of approximately 6.4 eV. This exceeds the bond energy of many organic molecular bonds, enabling photochemical ablation rather than thermal vaporization.
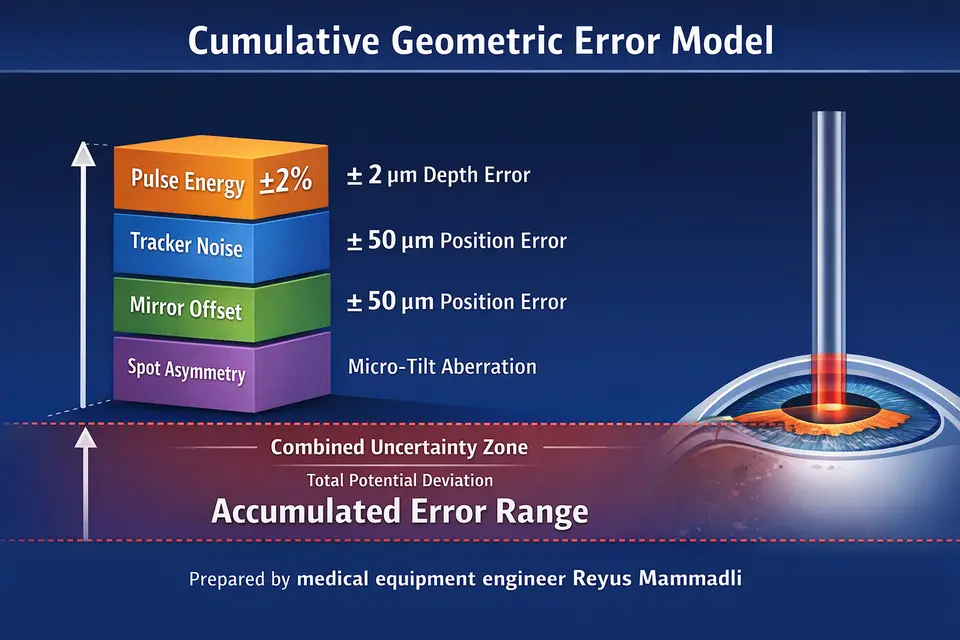
Typical ablation efficiency reported in publicly available manufacturer technical documentation is approximately 0.20–0.25 µm per pulse at fluence levels around 160–200 mJ/cm² for contemporary ArF ophthalmic excimer platforms. This number is not merely descriptive — it defines geometric sensitivity. If a platform removes 0.25 µm per pulse, then a 100 µm correction requires roughly 400 pulses per point (ignoring overlap effects). A ±2% pulse energy variation therefore translates into approximately ±2 µm variation over a 100 µm treatment depth if uncompensated.
Vision Support: Quality AREDS 2 Formula eye vitamins can be found on Amazon.
That magnitude is clinically relevant. From an engineering standpoint, energy stability tolerance is not an abstract percentage; it is cumulative geometric error.
Most systems operate within a fluence window of roughly 120–250 mJ/cm², according to publicly available manufacturer technical specifications and regulatory summaries for ophthalmic ArF excimer systems. Below threshold, ablation becomes inconsistent due to incomplete bond disruption. Above ~250 mJ/cm², plume shielding and localized thermal effects increase, reducing linearity of the depth–fluence relationship. In practice, platforms are intentionally operated only moderately above threshold to preserve linear response.
This is a key design decision: operating closer to threshold improves geometric predictability but reduces tolerance to energy drift. Operating far above threshold increases robustness but reduces fine depth control.
Laser Source and Gas System Engineering
Commercial ophthalmic excimer systems use ArF gas mixtures containing argon, fluorine, and a buffer gas (often neon). Gas composition degrades due to photochemical reactions and electrode erosion. Manufacturer service documentation for contemporary excimer platforms typically specifies gas refill or replacement intervals in the range of approximately 0.5 to 2 million pulses.
Gas degradation affects three measurable outputs:
Expert Choice: Recommended by eye care professionals for managing dry eyes, styes, and blepharitis, this Heated Eye Mask provides the consistent moist heat therapy endorsed by the American Academy of Ophthalmology. It’s an effective, reusable solution for soothing irritation and improving oil gland function. Available on Amazon.
- Decrease in pulse energy
- Increased pulse-to-pulse variability
- Altered spatial beam profile symmetry
As fluorine concentration shifts, discharge efficiency changes. The system compensates using high-voltage discharge adjustments in a closed-loop control scheme based on internal photodiode measurements.
However, compensation has limits. If gas aging increases pulse variability from ±1% to ±3%, geometric depth predictability degrades proportionally. In my engineering assessment, long-term repeatability is often more dependent on gas stability than on nominal spot size.
Gas systems are comparable in principle to excimer sources used in semiconductor microlithography or UV micromachining. The difference is scale and maintenance interval, not physics.
Beam Delivery Architectures in Commercial Systems
Two principal architectures are implemented clinically:
Specialized Care: For persistent itching or flaking, eye care specialists recommend targeted formulas like this BetterLids Eyelid Ointment . This preservative-free, dermatologist-tested oat complex is a top choice for soothing sensitive skin and managing symptoms of blepharitis. Available for easy ordering on Amazon.
- Scanning slit systems
- Flying spot systems
The architectural difference determines how spatial error accumulates.
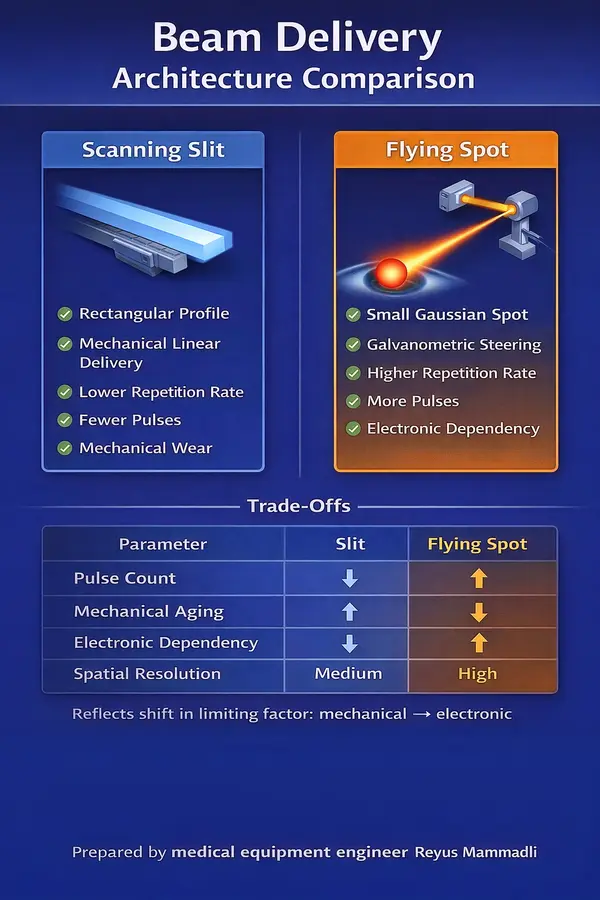
Scanning Slit Architecture
Scanning slit systems shape the beam into a rectangular slit typically several millimeters long and approximately 0.5–2.0 mm wide (according to manufacturer technical documentation for slit-based systems such as NIDEK EC-5000).
Because a larger corneal area is exposed per pulse, total pulse count is lower compared to small-spot systems. This reduces cumulative pulse-to-pulse error. However, geometric flexibility is constrained by slit width and mechanical translation resolution.
Mechanical translation must maintain positional tolerances on the order of tens of micrometers. Wear in guide rails, bearings, or linear actuators increases positioning variance over time. Unlike galvanometric systems, mechanical components exhibit gradual backlash and alignment drift.
The advantage is deterministic geometry: once aligned, slit projection is optically stable. The limitation is mechanical aging. Over years of operation, mechanical repeatability becomes the dominant stability factor.
Flying Spot Architecture
Flying spot systems use circular beams typically between 0.54 mm and 0.95 mm in diameter depending on platform, according to publicly available manufacturer technical specifications.
Representative values reported in publicly available manufacturer specifications include:
- WaveLight EX500: ~0.68 mm Gaussian flying spot; maximum repetition rate 500 Hz.
- VISX Star S4 IR: ~0.65 mm effective scanning beam; repetition rates up to 20 Hz in variable scanning mode.
- SCHWIND Amaris 1050RS: 0.54 mm small spot; repetition rate up to 1050 Hz.
The smaller the spot diameter, the higher the spatial resolution but the greater the pulse count required. For example, halving spot diameter approximately quadruples the number of pulses required to cover the same area at constant overlap.
This increases sensitivity to:
- Pulse energy drift
- Tracking latency
- Mirror positioning error
Galvanometric Beam Steering
Two-axis galvanometric mirrors steer the beam. Mirror angular precision on the order of microradians translates into sub-100 µm positional precision at the corneal plane depending on optical path geometry.
At 500–1050 Hz repetition rates, mirror settling time must be well below 1 ms. Servo control bandwidth and damping parameters become critical. Underdamped mirror systems produce micro-oscillations, which at high frequency can create subclinical but measurable surface roughness.
Unlike mechanical slit systems, galvanometric systems have minimal mechanical wear but depend heavily on electronic stability and calibration. Drift in position sensors or encoder feedback gradually shifts spatial accuracy unless recalibrated.
From an engineering perspective, flying spot systems trade mechanical aging for electronic and calibration discipline.
Table 1. Commercial Excimer Platforms and Beam Delivery Parameters
| Platform | Spot Diameter | Max Repetition Rate |
|---|---|---|
| WaveLight EX500 | ~0.68 mm | 500 Hz |
| VISX Star S4 IR | ~0.65 mm | up to 20 Hz |
| SCHWIND Amaris 1050RS | 0.54 mm | 1050 Hz |
(Values summarized from publicly available manufacturer technical documentation and regulatory summaries.)
The engineering significance of repetition rate is not only treatment speed. At 1050 Hz, inter-pulse interval is approximately 0.95 ms. This leaves less than 1 ms for mirror repositioning and tracking correction. System stability margin becomes extremely narrow.
Spatial Energy Distribution: Gaussian and Modified Gaussian Profiles
Most flying spot systems use Gaussian or dual-Gaussian energy distributions. A Gaussian beam concentrates energy centrally. If the beam becomes asymmetric due to optical contamination, ablation depth shifts off-axis.
For example, a 5% lateral energy asymmetry in a 0.6 mm spot can introduce measurable micro-tilt in the ablation surface if overlap compensation is not perfectly symmetric.
Beam homogenizers (microlens arrays or diffractive elements made from UV-grade fused silica) are used in some implementations to improve uniformity. These optics are highly sensitive to surface contamination and UV-induced micro-degradation. Over time, UV exposure can cause transmission loss or surface micro-roughening, subtly altering spatial distribution.
Thus, beam profile stability is not static. It degrades gradually with optical aging. Regular calibration masks small deviations, but large deviations require optical servicing.
Table 2. Beam Profile Type and Engineering Implications
| Profile Type | Practical Effect | Stability Sensitivity |
|---|---|---|
| Gaussian | High central energy density | Sensitive to asymmetry and contamination |
| Dual-Gaussian | Improved smoothness | Requires precise overlap control |
| Homogenized | More uniform depth per pulse | Sensitive to optical aging |
Pulse Frequency and Thermal Considerations
Repetition rates range from ~10 Hz in early slit systems to 1050 Hz in high-speed flying spot systems.
At 500 Hz, 5,000 pulses are delivered in 10 seconds. At 1050 Hz, the same pulse count requires under 5 seconds. Shorter treatment time reduces exposure to fixation instability but increases instantaneous energy delivery density.
Although ablation is primarily photochemical, experimental thermographic studies show measurable temperature increases during high-frequency treatments above 400 Hz without adequate spatial pulse redistribution.
Thermal accumulation is mitigated algorithmically by distributing pulses across non-adjacent coordinates. If this distribution algorithm is poorly tuned, local heat accumulation increases stromal hydration variability, which alters effective ablation efficiency.
This is a subtle but important point: ablation rate is partially hydration-dependent. Therefore, thermal management indirectly influences geometric accuracy.
Table 3. Pulse Frequency and Engineering Implications
| Repetition Rate | Engineering Constraint | Long-Term Stability Impact |
|---|---|---|
| ≤40 Hz | Mechanical precision dominant | Lower thermal stress |
| 200–500 Hz | Mirror bandwidth critical | Moderate calibration sensitivity |
| ≥800 Hz | Tight servo + tracking loop | High dependence on electronic stability |
Across modern platforms, architectural evolution reflects a shift from mechanically limited systems toward digitally limited systems. In current high-frequency flying spot designs, long-term geometric predictability depends less on raw optical power and more on calibration discipline, gas stability, optical cleanliness, and control loop integrity.
Ablation Control Algorithms in Contemporary Excimer Platforms
When refractive correction is executed on an excimer platform, the final corneal surface is created by stacking thousands of discrete ultraviolet pulses. What determines the quality of that surface is not only spot size or repetition rate, but how the control system distributes, sequences, and normalizes those pulses under real physical constraints.
A refractive profile is converted into a pulse execution plan defined by:
- A pulse density distribution (this is where the platform actually defines how much tissue will be removed locally; the algorithm decides how many pulses are assigned to each coordinate, effectively translating optical correction into cumulative energy)
- A spatial sequencing pattern (this determines whether adjacent tissue is exposed consecutively or thermally redistributed)
- An overlap ratio (this governs surface smoothness versus cumulative fluence load)
- A spot size strategy (single fixed or dual-spot execution)
- A pulse energy normalization routine (the stability backbone of the entire ablation process)
Each of these elements has a different implementation depending on the commercial platform.
Discretization Error and Spot Diameter Strategy
No system removes tissue continuously. The ablation surface is the superposition of overlapping pulses. Spatial fidelity depends primarily on spot diameter and positioning accuracy.
According to publicly available manufacturer specifications:
- Alcon WaveLight EX500 operates with a ~0.68 mm Gaussian flying spot at 500 Hz.
- Carl Zeiss MEL 90 uses a ~0.7 mm class flying spot with selectable 250 Hz or 500 Hz modes.
- SCHWIND Amaris 1050RS reports a ~0.54 mm small spot and operation up to 1050 Hz.
Smaller spots (e.g., ~0.54 mm as reported for Amaris 1050RS) increase spatial resolution but significantly increase pulse count per diopter of correction. That increases exposure to cumulative energy drift and positioning error. Larger fixed spots (e.g., ~0.68–0.7 mm class in EX500 or MEL 90) reduce pulse count and statistical noise but limit the maximum spatial frequency that can be physically reproduced.
Engineering note. Smaller spot systems also increase optical load on beam-shaping components. Because more pulses are required per treatment, cumulative UV exposure to final optics (lenses, windows, beam homogenizers) is higher per diopter corrected. In industrial UV micromachining systems, similar optics exhibit gradual transmission loss under sustained high pulse counts. Clinics rarely consider that higher spatial resolution architectures may demand stricter optical maintenance discipline over long-term operation.
If publicly available documentation does not disclose full spot modulation logic (as in some platforms), no assumptions are made regarding internal spot transition algorithms.
Pulse Density and Cumulative Energy Behavior
Pulse density is not simply a numeric distribution — it defines the statistical behavior of the treatment.
Assuming publicly reported ablation efficiency of approximately 0.20–0.25 µm per pulse at typical fluence levels (from manufacturer technical documentation), a 100 µm correction requires on the order of 400–500 effective pulses per coordinate depending on overlap.
High-density zones rely on statistical averaging of many pulses to suppress random ±1–3% pulse-to-pulse energy variation (as reported in manufacturer specifications). However, statistical averaging does not cancel systematic drift. If gas aging causes gradual upward fluence shift during treatment, depth error accumulates directionally.
Engineering note. What is often overlooked during procurement is that pulse density directly influences gas consumption rate. Systems delivering higher total pulse counts per correction deplete excimer gas mixtures faster. In semiconductor excimer tools, gas refresh interval is a critical cost parameter. The same physical chemistry applies here. Lower pulse-count strategies may offer long-term operational cost stability even if headline frequency is lower.
Platforms operating at higher repetition rates (e.g., 500 Hz in EX500 or up to 1050 Hz in Amaris 1050RS according to published specifications) compress the time window for such drift but increase instantaneous control demands.
Pulse Sequencing and Thermal Redistribution
At repetition rates above ~400 Hz (as reported for several modern flying spot systems), thermal redistribution becomes algorithmically necessary.
Public documentation for high-frequency systems indicates non-sequential pulse placement strategies. Although proprietary sequencing logic is not fully disclosed by manufacturers, the stated purpose is to avoid delivering consecutive pulses to adjacent coordinates.
For example:
- Systems operating at 500 Hz (WaveLight EX500, MEL 90 in high-speed mode) must redistribute pulses to prevent localized hydration shifts.
- Systems operating up to 1050 Hz (Amaris 1050RS) rely even more heavily on spatial redistribution because the inter-pulse interval is below 1 ms.
Where manufacturers do not disclose specific sequencing topology (randomized vs spiral vs sector-based), detailed comparison is not possible from open documentation.
Table 4. Pulse Sequencing Engineering Implications
| Sequencing Approach | Primary Engineering Goal | Hidden Sensitivity |
|---|---|---|
| Non-adjacent redistribution | Thermal load balancing | Increased algorithm complexity |
| Deterministic sector scanning | Regional energy control | Boundary transition artifacts |
| High-frequency randomization | Hydration stabilization | Higher computational demand |
(Strategies summarized from publicly available manufacturer technical descriptions; detailed proprietary logic not disclosed.)
Energy Normalization Architecture
Published specifications for contemporary platforms typically indicate pulse energy stability in the ±1–3% range under nominal conditions.
Energy monitoring is generally performed using internal photodiodes sampling a portion of each pulse. According to publicly available manufacturer documentation:
- WaveLight EX500 describes active pulse energy monitoring and automatic adjustment.
- MEL 90 documentation references active energy control.
- Amaris 1050RS publicly states high-frequency energy control.
However, detailed disclosure of feedback bandwidth, detector placement (pre- or post-final optics), and normalization granularity is limited in publicly available documentation across manufacturers.
This means that while pulse stability values are published, comparative analysis of control-loop architecture cannot be fully performed without service-level documentation.
Table 5. Energy Normalization Architecture Variables
| Parameter | What It Protects | Long-Term Risk Factor |
|---|---|---|
| Pulse-to-pulse monitoring | Instantaneous fluence stability | Photodiode aging |
| Automatic discharge adjustment | Compensation of gas drift | Calibration reference drift |
| Internal beam sampling | Feedback loop stability | Undetected downstream optical loss |
(Parameters summarized from publicly available manufacturer documentation.)
Dual-Spot and Variable Execution Strategies
Dual-spot execution is publicly described in manufacturer materials for:
- SCHWIND Amaris 1050RS (small ~0.54 mm spot for fine structure).
Platforms such as WaveLight EX500 and MEL 90 are described in public documentation as operating primarily with a single effective flying spot diameter.
Where documentation does not explicitly describe dynamic spot modulation (e.g., in some publicly available materials for Technolas TENEO 317), no assumption is made regarding internal transition algorithms.
Engineering implication:
- Dual-spot systems reduce bulk-treatment time but increase algorithmic dependency during spot transitions.
- Single-spot systems maintain geometric consistency but rely more heavily on overlap optimization.
Table 6. Spot Strategy and System Behavior
| Spot Strategy | Operational Advantage | Engineering Trade-Off |
|---|---|---|
| Single fixed spot | Predictable overlap behavior | Limited high-frequency resolution |
| Dual-spot execution | Efficient bulk + fine refinement | Transition sensitivity |
| Small-diameter high-speed spot | High spatial fidelity | Increased pulse count and UV optical load |
(Spot strategies summarized from publicly available manufacturer specifications.)
Calibration Discipline and Long-Term Drift
Manufacturer user manuals for major platforms describe daily or startup calibration routines including energy verification and beam alignment checks.
Publicly available documentation confirms that:
- EX500 includes automated calibration procedures.
- MEL 90 includes system check and calibration protocols.
- Amaris platforms describe automated energy control and system diagnostics.
However, publicly available documentation does not typically quantify long-term drift limits beyond nominal pulse stability specifications.
Long-term geometric stability therefore depends on:
- Gas refill discipline
- Optical surface cleanliness
- Photodiode aging behavior
- Mechanical stability of beam steering assemblies
Engineering note. Photodiodes used for internal pulse monitoring are typically silicon-based detectors operating near the edge of their spectral sensitivity at 193 nm. Over prolonged UV exposure, responsivity drift is a known phenomenon in ultraviolet measurement systems, including those used in industrial lithography. Unless periodically cross-calibrated against a reference sensor, absolute fluence accuracy can shift while internal relative stability remains within specification. This distinction is rarely visible in marketing materials but directly affects long-term refractive predictability.
Where manufacturers do not publish quantitative lifecycle drift data, no comparative durability ranking can be made.
In practical operation, algorithm sophistication cannot compensate for neglected calibration or optical degradation. The limiting factor is often maintenance rigor rather than nominal pulse frequency.
Eye Tracking Architecture and Dynamic System Behavior
Once ablation begins, the limiting factor is no longer optical resolution but motion compensation. The cornea moves in translation and rotation even during stable fixation. The real engineering question is not how fast the laser fires, but how tightly the tracker, mirrors, and pulse trigger are synchronized under motion.
Dynamic performance is defined by three coupled parameters:
- Tracker sampling frequency
- Total closed-loop latency
- Synchronization precision between tracker, mirrors, and laser pulse emission
If one of these elements underperforms, nominal laser specifications lose practical meaning.
Tracker Sampling Frequency in Current Platforms
According to publicly available manufacturer specifications:
- Carl Zeiss MEL 90 – tracker frequency reported at 250 Hz.
- Alcon WaveLight EX500 – documentation describes 400–500 Hz class tracking.
- SCHWIND Amaris 1050RS – publicly reports tracking frequency up to 1050 Hz.
At 250 Hz, eye position is updated every 4 ms. At 500 Hz, every 2 ms. At 1050 Hz, approximately every 0.95 ms.
Engineering interpretation:
If laser firing frequency equals or exceeds tracker update frequency, one or more pulses may be delivered using outdated positional data. At 500 Hz firing (2 ms interval) with 250 Hz tracking (4 ms update), two pulses can theoretically be emitted before positional refresh. That means up to two spots may be misplaced during a micro-saccade.
For procurement decisions, this is critical: tracker frequency should not be evaluated independently from laser firing rate. A mismatch increases the probability of dynamic decentration under real fixation conditions.
Engineering note. Published tracker frequency without disclosed end-to-end latency can be misleading. What matters is effective closed-loop delay (tracking + processing + mirror actuation). If total latency approaches or exceeds the inter-pulse interval, increasing nominal tracker frequency provides diminishing practical benefit. Public documentation rarely discloses full latency budgets; therefore, direct inter-platform dynamic precision comparison cannot be fully quantified from open sources.
Closed-Loop Latency and Mirror Response
Total latency includes:
- Camera exposure time
- Image processing time
- Control computation
- Galvanometric mirror repositioning time
- Laser trigger delay
Manufacturers typically publish tracker frequency but do not publish complete end-to-end latency values in publicly accessible documents. Where latency values are not disclosed, precise dynamic ranking is not possible.
Galvanometric mirrors used in excimer platforms are similar in principle to those used in industrial laser marking and micromachining systems. Their response time depends on mirror inertia, coil drive current, and servo damping.
From a reliability standpoint, mirror assemblies represent one of the few moving precision components in the optical chain. Bearing wear, encoder drift, or thermal expansion introduce systematic spatial offsets rather than random noise. This means errors can remain invisible during short-term testing yet affect long-term reproducibility.
Engineering note. In procurement evaluation, the availability of factory recalibration procedures for mirror linearity and offset is more important than nominal mirror speed. Industrial scanning systems require periodic linearity correction; the same physical drift mechanisms exist in excimer platforms, even if not emphasized in brochures.
Synchronization and Pulse Timing Jitter
Effective motion compensation requires deterministic synchronization between tracker acquisition, mirror command update, and pulse emission.
For example, with a ~0.6 mm spot diameter (as reported for WaveLight EX500 class systems), a 100 µm positioning deviation represents roughly 17% of spot radius. At high spatial frequency corrections, this magnitude of error contributes directly to residual higher-order aberrations.
Public documentation confirms active x–y tracking for major platforms. Some manufacturers also describe static and dynamic cyclotorsion compensation (e.g., WaveLight EX500 and Amaris series in publicly available materials). Numerical torsional precision values are generally not disclosed.
Where synchronization jitter tolerances are not published, precise quantitative comparison between systems cannot be made from open documentation.
Table 7. Tracker Frequency and Dynamic Interaction with Laser Firing
| Platform (Public Data) | Tracker Frequency | Potential Dynamic Constraint |
|---|---|---|
| MEL 90 | 250 Hz | Multi-pulse interval at ≥500 Hz firing |
| WaveLight EX500 | 400–500 Hz | Balanced for 500 Hz class firing |
| Amaris 1050RS | Up to 1050 Hz | Requires minimal latency for benefit |
(Frequencies summarized from publicly available manufacturer specifications.)
Cyclotorsion Compensation
Rotational alignment becomes critical when correcting higher-order aberrations or performing topography-driven treatments.
Publicly available documentation indicates:
- WaveLight EX500 – static and dynamic cyclotorsion compensation described.
- Amaris series – rotational tracking described in manufacturer materials.
Quantitative angular resolution values are not typically disclosed in open documentation.
Engineering interpretation:
Rotational compensation requires real-time coordinate transformation of the ablation matrix. This transformation must occur within the same latency window as translational correction. If computational delay exceeds tracking update interval, rotational correction becomes partially retrospective rather than predictive.
From an engineering standpoint, torsional tracking is particularly sensitive in small-spot systems (<0.6 mm class spots as reported in public specifications). A rotational misalignment of just 2° at a 3 mm radius corresponds to approximately 100 µm tangential displacement. In high-resolution treatments, this magnitude is not negligible.
Therefore, when torsional correction is advertised, the relevant question is not only whether it exists, but how quickly the rotational transform is executed relative to pulse emission timing.
Tolerance Stack-Up and Cumulative Dynamic Error
Dynamic error during treatment is cumulative and arises from:
- Tracker measurement noise
- Latency-induced positional delay
- Mirror positioning tolerance
- Pulse timing jitter
- Energy normalization variability
Each component may individually remain within published specification. However, combined tolerance stack-up can approach clinically meaningful thresholds, particularly in small-spot, high-frequency systems.
For example, 50 µm tracker noise + 50 µm mirror offset + 1% energy depth variation may each fall within nominal tolerance, yet together produce measurable optical zone irregularity. These errors do not simply add linearly; their spatial interaction determines final surface quality.
Manufacturers publish pulse stability (±1–3%) and tracker frequency values, but comprehensive tolerance stack analysis is not typically included in publicly available documentation.
Engineering note. When evaluating systems, asking for combined dynamic accuracy under motion (not individual subsystem specifications) provides a more realistic indicator of performance. Without considering cumulative dynamic error, nominal specification values may overestimate practical geometric precision.
Table 8. Major Contributors to Dynamic Geometric Uncertainty
| Error Source | Immediate Effect | Long-Term Operational Risk |
|---|---|---|
| Tracker noise | Positional jitter | Surface irregularity variability |
| Loop latency | Decentration under motion | Induced aberration persistence |
| Mirror drift | Systematic spatial shift | Reproducibility degradation |
| Energy fluctuation | Depth variation | Refractive variability |
Long-Term Dynamic Stability in Clinical Operation
Over extended service life, dynamic performance depends on subsystem aging:
- CMOS or CCD tracker sensors may exhibit sensitivity drift.
- Galvanometric mirror position sensors can experience offset variation.
- Mechanical mounts may shift under repeated thermal cycling.
Public documentation typically emphasizes startup calibration procedures but rarely quantifies long-term dynamic drift envelopes.
From an engineering standpoint, the sustainable precision of an excimer platform is defined not by peak tracker frequency but by how rigorously dynamic subsystems are recalibrated, maintained, and environmentally controlled.
Two platforms with similar published specifications may diverge in real-world predictability depending on service infrastructure and maintenance culture. The limiting factor is rarely maximum firing rate. It is the coherence and stability of the entire motion-control chain over time.
Engineering Questions to Ask Before Purchasing an Excimer Platform
When a clinic evaluates an excimer laser system, brochures usually emphasize speed, customization modes, and tracking frequency. From an engineering standpoint, long-term reliability and geometric predictability depend on a much smaller set of critical subsystems. Below are five technically meaningful questions that directly affect stability, service cost, and long-term reproducibility.
1. How is Pulse Energy Measured and Where Is It Sampled?
Why this matters:
Energy stability determines ablation depth accuracy. However, not all systems measure energy at the same optical location. If energy is sampled upstream of final optics, contamination or degradation of downstream lenses may not be fully compensated.
Good answer:
The manufacturer clearly explains whether energy is sampled before or after final beam-shaping optics, describes pulse-to-pulse monitoring (not batch averaging), and provides calibration procedures referencing an external standard.
Concerning answer:
Energy stability is described only as “±X%” without explanation of sampling location or detector aging compensation. If no periodic detector recalibration protocol is described, long-term absolute accuracy may drift.
2. What Is the Gas Replacement Interval and How Does Pulse Count Affect It?
Why this matters:
Excimer lasers rely on ArF gas mixtures that degrade with use. Higher pulse counts per treatment accelerate gas depletion. Gas chemistry stability directly influences pulse energy consistency.
Good answer:
The manufacturer specifies gas lifetime in pulses, explains how pulse density strategies affect consumption, and provides transparent replacement cost and procedure time.
Concerning answer:
Gas replacement interval is described only in months rather than pulse count, or cost per refill is not clearly disclosed. If pulse count per correction is high and gas lifetime is short, operational cost may scale rapidly with case volume.
3. How Are Galvanometric Mirrors Calibrated Over Time?
Why this matters:
Galvo mirrors are precision electromechanical components. Over years of operation, bearing wear, encoder drift, and thermal cycling introduce systematic spatial offsets.
Good answer:
The system includes documented mirror linearity calibration routines, factory or field recalibration capability, and specified tolerance limits after service intervals.
Concerning answer:
Mirror speed is emphasized, but no information is provided about long-term alignment verification. Absence of documented recalibration procedures increases risk of gradual spatial drift that may not be immediately visible.
4. What Is the Total Closed-Loop Latency (Not Just Tracker Frequency)?
Why this matters:
Tracking frequency alone does not determine motion compensation accuracy. The true parameter is total latency from eye movement detection to pulse emission adjustment.
Good answer:
The manufacturer provides either a quantified end-to-end latency value or a technical explanation of processing, mirror response, and trigger synchronization.
Concerning answer:
Only nominal tracker frequency (e.g., 500 Hz or 1000 Hz) is advertised, with no discussion of processing delay. If latency approaches inter-pulse interval, dynamic correction benefit may be limited.
5. Which Optical Components Are Most UV-Exposed and How Are They Maintained?
Why this matters:
UV radiation at 193 nm gradually affects optical coatings and transmissive elements. Systems using smaller spots and higher pulse counts expose optics to greater cumulative UV load.
Good answer:
The manufacturer identifies high-exposure components (e.g., final window, homogenizer, beam-shaping optics), specifies inspection intervals, and provides expected replacement timelines.
Concerning answer:
Optical durability is not discussed. If replacement cost, service interval, or degradation detection method is unclear, long-term fluence uniformity may decline without obvious warning.
Practical Interpretation
The most reliable excimer platform is not necessarily the fastest or the one with the highest nominal tracker frequency. It is the system for which:
- Energy measurement architecture is transparent.
- Gas management parameters are quantified in pulse-based metrics.
- Mirror calibration procedures are documented.
- Closed-loop latency is technically described.
- Optical wear mechanisms are acknowledged and managed.
These questions move evaluation from marketing comparison to engineering due diligence. A purchaser who receives clear, technically grounded answers to these points is in a significantly stronger position to assess long-term reliability and cost stability.
References
- Alcon – WaveLight Excimer Laser Systems
https://www.alcon.com - Carl Zeiss Meditec – MEL 90 Excimer Laser Platform
https://www.zeiss.com/ - Johnson & Johnson Vision – VISX Star S4 IR
https://www.jnjvision.com - SCHWIND eye-tech-solutions – Amaris Series
https://www.eye-tech-solutions.com - Bausch + Lomb – Technolas Excimer Systems
https://www.bausch.com - NIDEK Co., Ltd. – EC-5000 and Excimer Platforms
https://www.nidek.com - U.S. Food and Drug Administration (FDA) – Medical Device Databases
https://www.fda.gov - American National Standards Institute (ANSI) – Laser Safety and Performance Standards
https://www.ansi.org - International Electrotechnical Commission (IEC) – Laser Equipment Standards (IEC 60825 series)
https://www.iec.ch