Optical Coherence Tomography (OCT) systems rarely lose image quality suddenly. In most cases, degradation begins quietly—through mechanical fatigue, thermal instability, and gradual optical contamination. When scans start to drift, layers appear irregular, or noise increases, the cause is often physical wear inside the instrument rather than software malfunction.
As a medical equipment engineer, I see recurring patterns behind these changes. Clinicians and procurement specialists frequently ask why two systems of similar age perform differently, or why an otherwise functional device requires increasing recalibration. The answers are usually mechanical and optical. These processes are predictable, measurable, and directly related to design choices, duty cycle, and environmental conditions.
Understanding these engineering mechanisms helps interpret image behavior correctly and evaluate the true condition of an OCT system before problems become clinically significant.
Vision Support: Quality AREDS 2 Formula eye vitamins can be found on Amazon.
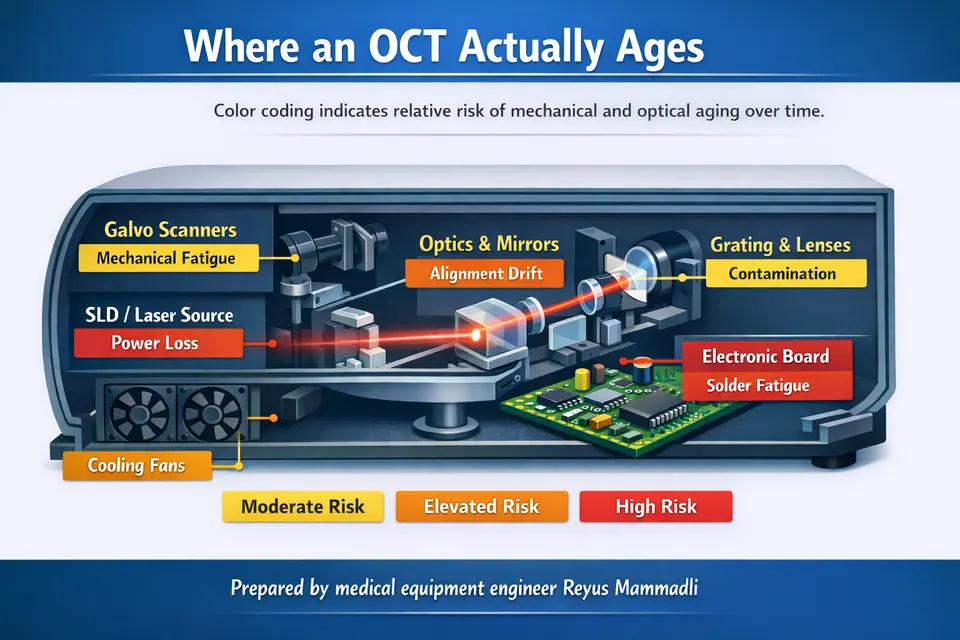
The Pulse of the Interferometer: Galvanometric Scanners and Mechanical Fatigue
Most Spectral-Domain OCT systems use dual-axis galvanometric scanners with electromagnetic drive and torsion-bar suspension. According to technical datasheets from precision scanner manufacturers such as Cambridge Technology (USA) and Scanlab (Germany), positioning repeatability is commonly specified in the range of ±0.5–1 µrad. After scan optics, this corresponds to sub-micron displacement at the retinal plane.
Key engineering fact: galvanometric mirrors in OCT operate as continuously cycling mechanical oscillators, not static optical elements.
In clinical OCT, fast-axis frequencies typically range from 200–800 Hz, while A-scan rates range from ~20 kHz to >100 kHz depending on spectrometer design (manufacturer service manuals and system specifications). At 400 Hz over an 8-hour workday, the fast axis completes more than 11 million oscillation cycles per day. Over five years of weekday operation, this exceeds 10 billion cycles.
Fatigue behavior of torsion elements follows classical S–N (Wöhler) curves for cyclic loading, as described in mechanical fatigue theory (ASTM E466 standard test method for fatigue of metallic materials). Even if stress amplitudes are below yield strength, cumulative microstructural damage accumulates. From an engineering standpoint, this cycle count is absolutely relevant.
Two parameters determine image stability:
Expert Choice: Recommended by eye care professionals for managing dry eyes, styes, and blepharitis, this Heated Eye Mask provides the consistent moist heat therapy endorsed by the American Academy of Ophthalmology. It’s an effective, reusable solution for soothing irritation and improving oil gland function. Available on Amazon.
- Static positioning linearity (deviation from commanded waveform)
- Dynamic step response (overshoot, settling time, ringing)
These parameters are standard in servo control engineering and are defined in classical control theory (e.g., step response and frequency response characterization). Small increases in settling time or overshoot may appear negligible in isolation. However, during raster scanning, edge distortions accumulate spatially.
Critical distinction:
- Minor jitter increase (<5–10% of specification) is often clinically tolerable.
- Loss of linearity or edge overshoot directly alters spatial mapping and is clinically significant.
In my engineering assessment, early-stage non-linearity is frequently underestimated because the image still “looks acceptable.” Geometric accuracy, however, is already compromised.
Duty Cycle as a Lifespan Multiplier
Galvanometer lifespan is primarily a function of cycle count and thermal load, not calendar age. Many OCT systems remain powered 10–24 hours per day. Even when not actively scanning, driver electronics may maintain bias current to reduce latency.
Specialized Care: For persistent itching or flaking, eye care specialists recommend targeted formulas like this BetterLids Eyelid Ointment . This preservative-free, dermatologist-tested oat complex is a top choice for soothing sensitive skin and managing symptoms of blepharitis. Available for easy ordering on Amazon.
Manufacturer life expectancy for precision galvos used in continuous industrial duty is commonly specified in the range of 20,000–40,000 operating hours before performance drift exceeds tolerance (component datasheets from major galvo suppliers). In a clinic operating 12 hours daily, this threshold can be reached in approximately 4–6 years.
Important procurement insight: lifespan is governed by accumulated operating hours and thermal load, not by calendar age.
From my experience, two identical systems of the same production year can differ significantly in geometric stability purely due to duty cycle. This is rarely visible in external inspection but measurable in calibration drift frequency.
Engineering Parameters of Galvanometric Scanners in Clinical OCT
| Parameter | Typical Range | Engineering Impact |
|---|---|---|
| Fast-axis frequency | 200–800 Hz | Higher frequency increases fatigue cycles and heat load |
| Repeatability | ±0.5–1 µrad | Loss causes spatial drift and layer misalignment |
| Continuous-duty life | 20,000–40,000 h | Beyond this, recalibration frequency increases |
From an engineering perspective, small increases in jitter (<5–10% of specification) may not immediately affect clinical interpretation. However, loss of linearity or increased settling error at scan edges is critical because it directly alters spatial mapping of retinal layers.
Forced Induction Cooling and the “Vacuum Cleaner” Effect
Most OCT platforms use forced-air cooling with axial or centrifugal fans rated between 20–60 CFM. This approach complies with temperature rise limits defined in IEC 60601-1 for medical electrical equipment. It is thermally efficient but introduces continuous environmental air exchange.
Ambient clinical air typically contains particulate matter in the 1–10 µm range (ISO 14644 cleanroom classification standards provide particle size references). Unless the optical engine is hermetically sealed, this particulate load circulates near mirrors, collimators, and diffraction gratings.
Engineering reality: forced cooling improves thermal reliability but increases contamination risk unless optical isolation is implemented.
Thermal Stability and Optical Bench Expansion
Aluminum optical benches (CTE ≈ 23 µm/m·K) are common due to machinability and cost. A 5 K temperature gradient across a 200 mm optical path can theoretically introduce ~23 µm of dimensional change (calculated from material properties). In practice, mechanical constraints reduce this value, but even micron-level differential expansion affects interferometric balance.
Slow uniform drift is usually compensated during calibration. Rapid or asymmetric heating near scanner drivers or power supplies is more problematic because it creates localized misalignment.
Contamination and Signal-to-Noise Ratio (SNR)
Retinal OCT systems typically specify sensitivity in the range of 90–105 dB at the zero-delay line (manufacturer technical specifications). Sensitivity is fundamentally governed by interferometric detection theory, where SNR depends on coherent signal amplitude relative to noise floor.
A 3 dB reduction corresponds to approximately 50% reduction in signal power (logarithmic decibel definition per IEC 60027-3). Even small scattering losses reduce interference contrast.
Practical SNR thresholds:
- 1–2 dB reduction → often tolerable and partially compensated digitally.
- 3–5 dB reduction or greater → visibly increased noise and clinically relevant contrast loss.
In my engineering opinion, contamination-related attenuation is frequently misdiagnosed as source aging. Before replacing a light source approaching its specified lifetime (often 5,000–10,000 hours for broadband SLD modules per manufacturer documentation), the optical path condition should be evaluated.
Optical Path Contamination and Its Effect on Signal Quality
| Contamination Type | Optical Effect | Clinical Manifestation |
|---|---|---|
| Fine dust (1–10 µm) | Mie scattering, reduced coherence | Grainy background noise |
| Humidity film | Transmission loss | Reduced brightness, contrast |
| Grating contamination | Spectral distortion | Uneven axial intensity profile |
In systems older than five years operating in high-dust environments without regular internal maintenance, measurable SNR degradation is common. In my assessment, contamination-related attenuation is frequently misdiagnosed as source aging, although the light source may still operate within voltage and output specifications.
Optical Coherence Tomography (OCT) systems rarely lose image quality suddenly. In most cases, degradation begins quietly—through mechanical fatigue, thermal instability, and gradual optical contamination. When scans start to drift, layers appear irregular, or noise increases, the cause is often physical wear inside the instrument rather than software malfunction.
As a medical equipment engineer, I see recurring patterns behind these changes. Clinicians and procurement specialists frequently ask why two systems of similar age perform differently, or why an otherwise functional device requires increasing recalibration. The answers are usually mechanical and optical. These processes are predictable, measurable, and directly related to design choices, duty cycle, and environmental conditions.
Understanding these engineering mechanisms helps interpret image behavior correctly and evaluate the true condition of an OCT system before problems become clinically significant.
The Pulse of the Interferometer: Galvanometric Scanners and Mechanical Fatigue
Most Spectral-Domain OCT systems use dual-axis galvanometric scanners with electromagnetic drive and torsion-bar suspension. According to technical datasheets from precision scanner manufacturers such as Cambridge Technology (USA) and Scanlab (Germany), positioning repeatability is commonly specified in the range of ±0.5–1 µrad. After scan optics, this corresponds to sub-micron displacement at the retinal plane.
Key engineering fact: galvanometric mirrors in OCT operate as continuously cycling mechanical oscillators, not static optical elements.
In clinical OCT, fast-axis frequencies typically range from 200–800 Hz, while A-scan rates range from ~20 kHz to >100 kHz depending on spectrometer design (manufacturer service manuals and system specifications). At 400 Hz over an 8-hour workday, the fast axis completes more than 11 million oscillation cycles per day. Over five years of weekday operation, this exceeds 10 billion cycles.
Fatigue behavior of torsion elements follows classical S–N (Wöhler) curves for cyclic loading, as described in mechanical fatigue theory (ASTM E466 standard test method for fatigue of metallic materials). Even if stress amplitudes are below yield strength, cumulative microstructural damage accumulates. From an engineering standpoint, this cycle count is absolutely relevant.
Two parameters determine image stability:
- Static positioning linearity (deviation from commanded waveform)
- Dynamic step response (overshoot, settling time, ringing)
These parameters are standard in servo control engineering and are defined in classical control theory (e.g., step response and frequency response characterization). Small increases in settling time or overshoot may appear negligible in isolation. However, during raster scanning, edge distortions accumulate spatially.
Critical distinction:
- Minor jitter increase (<5–10% of specification) is often clinically tolerable.
- Loss of linearity or edge overshoot directly alters spatial mapping and is clinically significant.
In my engineering assessment, early-stage non-linearity is frequently underestimated because the image still “looks acceptable.” Geometric accuracy, however, is already compromised.
Duty Cycle as a Lifespan Multiplier
Galvanometer lifespan is primarily a function of cycle count and thermal load, not calendar age. Many OCT systems remain powered 10–24 hours per day. Even when not actively scanning, driver electronics may maintain bias current to reduce latency.
Manufacturer life expectancy for precision galvos used in continuous industrial duty is commonly specified in the range of 20,000–40,000 operating hours before performance drift exceeds tolerance (component datasheets from major galvo suppliers). In a clinic operating 12 hours daily, this threshold can be reached in approximately 4–6 years.
Important procurement insight: lifespan is governed by accumulated operating hours and thermal load, not by calendar age.
From my experience, two identical systems of the same production year can differ significantly in geometric stability purely due to duty cycle. This is rarely visible in external inspection but measurable in calibration drift frequency.
Engineering Parameters of Galvanometric Scanners in Clinical OCT
| Parameter | Typical Range | Engineering Impact |
|---|---|---|
| Fast-axis frequency | 200–800 Hz | Higher frequency increases fatigue cycles and heat load |
| Repeatability | ±0.5–1 µrad | Loss causes spatial drift and layer misalignment |
| Continuous-duty life | 20,000–40,000 h | Beyond this, recalibration frequency increases |
From an engineering perspective, small increases in jitter (<5–10% of specification) may not immediately affect clinical interpretation. However, loss of linearity or increased settling error at scan edges is critical because it directly alters spatial mapping of retinal layers.
Forced Induction Cooling and the “Vacuum Cleaner” Effect
Most OCT platforms use forced-air cooling with axial or centrifugal fans rated between 20–60 CFM. This approach complies with temperature rise limits defined in IEC 60601-1 for medical electrical equipment. It is thermally efficient but introduces continuous environmental air exchange.
Ambient clinical air typically contains particulate matter in the 1–10 µm range (ISO 14644 cleanroom classification standards provide particle size references). Unless the optical engine is hermetically sealed, this particulate load circulates near mirrors, collimators, and diffraction gratings.
Engineering reality: forced cooling improves thermal reliability but increases contamination risk unless optical isolation is implemented.
Thermal Stability and Optical Bench Expansion
Aluminum optical benches (CTE ≈ 23 µm/m·K) are common due to machinability and cost. A 5 K temperature gradient across a 200 mm optical path can theoretically introduce ~23 µm of dimensional change (calculated from material properties). In practice, mechanical constraints reduce this value, but even micron-level differential expansion affects interferometric balance.
Slow uniform drift is usually compensated during calibration. Rapid or asymmetric heating near scanner drivers or power supplies is more problematic because it creates localized misalignment.
Contamination and Signal-to-Noise Ratio (SNR)
Retinal OCT systems typically specify sensitivity in the range of 90–105 dB at the zero-delay line (manufacturer technical specifications). Sensitivity is fundamentally governed by interferometric detection theory, where SNR depends on coherent signal amplitude relative to noise floor.
A 3 dB reduction corresponds to approximately 50% reduction in signal power (logarithmic decibel definition per IEC 60027-3). Even small scattering losses reduce interference contrast.
Practical SNR thresholds:
- 1–2 dB reduction → often tolerable and partially compensated digitally.
- 3–5 dB reduction or greater → visibly increased noise and clinically relevant contrast loss.
In my engineering opinion, contamination-related attenuation is frequently misdiagnosed as source aging. Before replacing a light source approaching its specified lifetime (often 5,000–10,000 hours for broadband SLD modules per manufacturer documentation), the optical path condition should be evaluated.
Optical Path Contamination and Its Effect on Signal Quality
| Contamination Type | Optical Effect | Clinical Manifestation |
|---|---|---|
| Fine dust (1–10 µm) | Mie scattering, reduced coherence | Grainy background noise |
| Humidity film | Transmission loss | Reduced brightness, contrast |
| Grating contamination | Spectral distortion | Uneven axial intensity profile |
In systems older than five years operating in high-dust environments without regular internal maintenance, measurable SNR degradation is common. In my assessment, contamination-related attenuation is frequently misdiagnosed as source aging, although the light source may still operate within voltage and output specifications.
Precision Alignment: Why “Field Cleaning” Is a Multi-Thousand Dollar Risk
Optical Coherence Tomography is an interferometric system. Unlike conventional imaging optics, it does not tolerate casual mechanical disturbance. Alignment tolerances are defined not by image sharpness alone, but by interference visibility and coherence matching.
Engineering principle: in interferometry, micron-level displacement can determine whether interference exists at all.
Optical Bench Stability and Structural Materials
Most commercial OCT systems use CNC-machined aluminum optical benches due to manufacturability, weight, and cost. Aluminum has a coefficient of thermal expansion (CTE) of approximately 23 µm/m·K (standard material property data). In contrast, Invar alloys exhibit CTE values near 1–2 µm/m·K.
In a 200 mm optical path, a 5 K temperature change theoretically corresponds to ~23 µm dimensional change in aluminum (ΔL = α·L·ΔT). Mechanical constraints reduce effective displacement, but micron-scale drift remains realistic.
Critical distinction:
- In conventional fundus imaging optics, micron drift may be negligible.
- In OCT interferometry, axial path mismatch directly reduces fringe visibility.
From my engineering perspective, aluminum is a rational compromise in mid-range systems. However, it makes thermal stabilization and calibration discipline essential. Systems without stable internal thermal equilibrium require more frequent recalibration.
Anti-Reflective (AR) Coatings at 840 nm and 1050 nm
Retinal OCT commonly operates around 840 nm, while deeper-penetration systems use ~1050 nm sources. Optical elements are coated with multilayer dielectric anti-reflective (AR) coatings optimized for narrow spectral bands. These coatings are typically quarter-wave stack designs governed by thin-film interference theory.
International standards such as ISO 9211 define durability and optical performance requirements for coated optics. Typical residual reflectance per surface is specified below 0.5% in high-quality systems (manufacturer optical component datasheets).
Important engineering reality: AR coatings are mechanically thin and spectrally tuned. They are not general-purpose protective layers.
Improper solvents or abrasive wipes can create micro-scratches. Even sub-visible damage increases back-reflection. In interferometric systems, additional back-reflection introduces parasitic interference (ghost fringes) and contrast reduction.
In my experience, field cleaning without proper optical protocol is one of the most expensive mistakes in OCT maintenance. The damage may not be immediately obvious but manifests as reduced contrast or unstable fringe patterns.
Alignment Tolerance and Coherence Length Constraints
OCT axial resolution and interference behavior depend on the coherence length of the light source. For broadband superluminescent diodes (SLDs) centered at 840 nm with bandwidths around 40–60 nm, coherence length is typically on the order of 5–15 µm (derived from coherence theory and manufacturer SLD specifications). Swept sources at 1050 nm exhibit comparable axial coherence constraints depending on sweep bandwidth.
Interference fringe visibility drops rapidly when optical path mismatch exceeds coherence length.
Engineering threshold:
- Optical path mismatch within ±10–20 µm → stable interference.
- Mismatch exceeding coherence envelope → fringe amplitude collapses.
A 50 µm lens displacement during mechanical disturbance or improper cleaning can move the system outside optimal coherence overlap. In conventional optics this displacement is trivial. In OCT, it can eliminate usable interference signal.
From an engineering standpoint, this is why “simple wiping” of internal optics is risky. Mechanical disturbance and coating damage combine to produce both alignment error and reflectivity imbalance.
Critical Alignment and Coating Parameters in Clinical OCT
| Parameter | Typical Value | Engineering Consequence |
|---|---|---|
| Optical path matching tolerance | ±10–20 µm | Loss of fringe visibility beyond this range |
| AR residual reflectivity | <0.5% per surface | Increased ghosting if exceeded |
| SLD coherence length (840 nm, 40–60 nm BW) | 5–15 µm | Defines allowable axial mismatch |
From my engineering assessment, optical alignment degradation is less frequent than scanner fatigue, but when it occurs, it is far more costly. Unlike gradual SNR loss from dust, alignment errors often require factory-level recalibration or full optical head replacement.
Artifact Anatomy: When Mechanics Masquerade as Pathology
Mechanical degradation does not always present as obvious failure. More often, it produces repeatable geometric artifacts that can be mistaken for anatomical irregularities.
Step-Response Errors in Aging Galvanometers
In servo-controlled systems, step response is characterized by overshoot percentage, settling time, and damping ratio. These are standard control system parameters derived from classical feedback theory.
As torsion elements fatigue or bearing friction increases, damping characteristics change. Overshoot may increase by a few percent; settling time may lengthen by microseconds. These deviations appear small in electrical measurement but spatially accumulate during raster scanning.
Clinically relevant indicator: if distortion consistently appears at the same scan position across repeated acquisitions, the origin is mechanical, not biological.
From my engineering experience, early overshoot-related artifacts are frequently dismissed as patient motion. However, motion artifacts are inconsistent. Servo-induced distortion is position-locked.
Recognizing Vertical Misalignment in B-Scans
Mechanical non-linearity often manifests as:
- Stair-stepping at scan edges
- Jagged appearance of otherwise smooth retinal layers
- Subtle periodic ripples
If the patient is stable and fixation is good, these patterns suggest scanner linearity degradation or dynamic response asymmetry.
In my opinion, clinicians should occasionally perform repeat scans on a stable test object or phantom. Mechanical artifacts reproduce predictably. Pathology does not.
Mechanical Artifact vs Clinical Pathology Indicators
| Feature | Mechanical Origin | Pathological Origin |
|---|---|---|
| Edge ripple at same scan position | Common | Rare |
| Layer irregularity identical across scans | Common | Unlikely |
| Localized structural disruption | Uncommon | Common |
Understanding this distinction protects against both overdiagnosis and unnecessary hardware replacement. Mechanical artifacts are systematic. Pathology is spatially specific and biologically variable.
Operational Conditions That Accelerate OCT Degradation
OCT degradation is rarely random. It follows identifiable physical stress patterns. Calendar age alone is a poor predictor of system condition. Accumulated operating hours, environmental exposure, and thermal cycling are far more relevant.
Engineering principle: mechanical fatigue, optical contamination, and electronic drift scale with stress exposure — not ownership duration.
Continuous Power-On Operation
Many clinics leave OCT systems powered 10–24 hours per day. Even when idle, scanner drivers may maintain bias current, internal electronics remain thermally active, and in some architectures the light source does not fully enter zero-output standby.
Superluminescent diode (SLD) modules used in 840 nm systems typically specify operational lifetimes in the range of 5,000–10,000 hours before output power decreases below nominal tolerance (manufacturer datasheets from major SLD suppliers such as Exalos or Superlum). Swept sources may specify longer MTBF, but also exhibit output drift over time.
At 12 hours per day, 5 days per week, 6,000 operating hours are reached in roughly two years.
Critical implication: brightness drift within 2–3 years in high-duty clinics is not abnormal — it is statistically expected.
From my engineering perspective, systems that remain continuously powered without intelligent standby shorten both scanner and source service life. If rapid readiness is required, thermal standby modes should be verified rather than assuming full idle shutdown.
High-Volume Clinical Throughput
In screening centers processing 150–250 patients per day, scanners may operate near continuous dynamic load. As previously discussed, fast-axis oscillation at 400 Hz accumulates millions of cycles daily. Fatigue damage follows cumulative cycle models (ASTM E466 fatigue methodology).
Procurement insight: two systems of identical age may differ drastically if one operates in a low-volume specialty clinic and the other in a screening facility.
In my assessment, service intervals in high-volume environments should be shortened by 20–30% relative to manufacturer baseline recommendations.
Thermal Cycling and Power Transitions
Repeated daily power-up and shutdown creates thermal cycling stress. Electronic assemblies experience expansion and contraction governed by material CTE differences. Solder joint fatigue under cyclic thermal loading is well documented in IPC-9701 reliability testing standards.
A daily ΔT of 15–20 K between powered and unpowered states over several years produces thousands of thermal cycles. Under IPC-9701 thermal cycling reliability models, solder joint lifetime decreases as a function of strain amplitude caused by coefficient-of-thermal-expansion mismatch between PCB substrate, solder alloy, and component leads.
In OCT systems, this translates into gradual increase in contact resistance, intermittent instability in detector or scanner driver circuits, and eventual calibration drift. The mechanism is mechanical strain accumulation at the microstructure level, not random electronic failure.
Engineering consequence: micro-cracking in solder joints, gradual connector resistance increase, and long-term calibration drift.
Continuous operation reduces thermal cycling stress but increases total operating hours. Frequent on–off cycles reduce total hours but increase mechanical and electronic fatigue from expansion mismatch. There is no perfect strategy — but uncontrolled daily thermal extremes should be avoided.
Humidity and Airborne Contamination
IEC 60601-1 operational environment guidelines typically assume indoor conditions of approximately 20–24°C and 40–60% relative humidity. It is important to understand what this standard actually ensures: electrical safety and safe temperature rise limits for patient-contact equipment. It does not define interferometric stability criteria or micron-level optical alignment tolerance.
From an engineering standpoint, compliance with IEC 60601-1 means the device will not overheat or create electrical hazards under specified ambient conditions. It does not guarantee that a 3–5 K internal gradient will not introduce several microns of differential expansion along the optical bench. Safety compliance and metrological stability are governed by different physical constraints. Sustained RH above 60% increases risk of thin moisture film formation on optical surfaces and accelerates corrosion in exposed metallic contacts.
Airborne particles in the 1–10 µm range (as characterized in ISO 14644 cleanroom classification standards) are common in clinical environments without controlled filtration. ISO 14644 defines particle concentration limits for controlled cleanroom classes; most outpatient clinics do not meet these classifications.
This matters because scattering cross-section for particles in the 1–10 µm range at near-infrared wavelengths (840–1050 nm) is significant under Mie scattering theory. In practical terms, typical clinical air contains enough particulate matter to measurably increase internal optical deposition over multi-year operation unless filtration is actively maintained.
Accelerating factors:
- RH >60% → increased optical film formation and coating stress
- Visible dust accumulation at ventilation inlets → increased internal deposition probability
- Mobile or multi-site units → higher exposure to particulate variation
From engineering experience, humidity-driven degradation is slower than mechanical fatigue but more difficult to diagnose because it mimics gradual SNR decline.
Cooling Fan Wear and Secondary Effects
Axial cooling fans commonly used in medical equipment specify lifetimes in the range of 30,000–50,000 hours (manufacturer fan datasheets, typically defined at 40°C ambient and rated load). Lifetime is typically defined to a specific L10 or L70 criterion, meaning a percentage of units are expected to fail before that time.
As bearings wear, imbalance increases and vibration amplitude rises. In precision optical assemblies, even low-level vibration can introduce micro-displacement at mirror mounts or scanner frames. While these displacements may be sub-micron, interferometric systems are sensitive to phase instability, making vibration a non-trivial secondary degradation pathway. Bearing wear increases vibration and acoustic noise.
Secondary impact: vibration from worn fans can introduce micro-alignment instability in sensitive optical assemblies.
This is rarely considered in clinical settings, yet in aging systems it contributes to increased recalibration frequency.
Operational Stress Factors and Engineering Impact
| Stress Factor | Typical Threshold | Engineering Consequence |
|---|---|---|
| Continuous operation | >6,000 h | Source output drift, scanner wear |
| High humidity | >60% RH | Optical film formation, corrosion |
| High daily throughput | >150 patients/day | Accelerated galvo fatigue |
| Fan wear | >30,000 h | Vibration-induced instability |
From my perspective, environmental control and duty cycle management extend practical OCT lifespan more effectively than reactive component replacement.
The Engineer’s Pre-Purchase and Condition Audit
When evaluating a used OCT system or assessing aging equipment, software menus are not sufficient. Hardware behavior must be examined.
Acoustic Profiling During Startup
A healthy OCT has a consistent, smooth acoustic signature during power-up. Grinding, intermittent clicking, or high-pitched tonal variation may indicate:
- Fan bearing degradation
- Scanner bearing wear
- Imbalance in rotating cooling components
Engineering recommendation: listen before scanning. Acoustic anomalies often precede measurable imaging artifacts.
Calibration Log Analysis
Most OCT systems maintain internal calibration history. Increasing frequency of manual recalibration to restore brightness or geometric alignment suggests:
- Optical contamination
- Source output decay approaching lower voltage threshold
- Scanner linearity drift
If recalibration intervals shorten progressively, the system is compensating for hardware instability.
From my engineering assessment, stable systems maintain relatively constant calibration intervals over years. Increasing frequency is an early warning indicator.
Output Power and End-of-Life Thresholds
Broadband SLD modules typically define end-of-life (EOL) when output drops to approximately 70–80% of initial rated power (manufacturer documentation varies). Compensation algorithms may temporarily mask this decline by increasing detector gain.
Critical distinction: digital gain recovery does not restore lost coherence amplitude.
If increased detector gain is required to maintain nominal brightness, noise floor rises proportionally. This is measurable in SNR reduction.
Mechanical Repeatability Test
A practical engineering test involves scanning a stable phantom target multiple times:
- Identical geometric distortion across scans → mechanical origin
- Random variation → patient or alignment variability
Repeatability testing provides more insight than a single high-quality image.
Engineering Audit Checklist for OCT Systems
| Checkpoint | Normal Behavior | Red Flag Indicator |
|---|---|---|
| Startup acoustics | Smooth, consistent hum | Grinding, tonal fluctuation |
| Calibration interval | Stable over years | Increasing recalibration frequency |
| Brightness stability | Minor gradual drift | Rapid compensation via gain |
| Geometric repeatability | Consistent scan geometry | Edge distortion or drift |
From an engineering standpoint, OCT lifespan is governed by physics: fatigue cycles, thermal gradients, contamination load, and optical tolerance limits. Software can compensate temporarily, but it cannot reverse material degradation.
Clinicians and procurement specialists who understand these parameters evaluate equipment more accurately and avoid both overdiagnosis of pathology and premature hardware replacement.
Engineering Checklist for Purchasing Used or Refurbished OCT Systems
The secondary OCT market is active, particularly in the United States, where trade-in and refurbishment programs are common. Used systems can be technically sound investments — but only if evaluated with engineering discipline.
Below is a focused checklist I recommend when assessing pre-owned equipment. Each question should produce a technically verifiable answer.
1. What Are the Total Operating Hours of the Light Source and System?
Why it matters: SLD modules typically specify 5,000–10,000 operating hours before output degradation beyond nominal tolerance. Scanner and fan wear also scale with accumulated hours.
- Acceptable answer: Documented hour counter readings from internal diagnostics; source hours significantly below specified lifetime; service records available.
- Red flag: No hour data available; seller refers only to “age” of the unit; source already near or beyond nominal lifetime without replacement documentation.
2. Can You Provide Calibration History Logs?
Why it matters: Increasing recalibration frequency indicates optical drift, contamination, or scanner linearity degradation.
- Acceptable answer: Stable calibration intervals over multiple years; no pattern of progressively shorter adjustment cycles.
- Red flag: Frequent recent recalibrations; missing historical logs; explanation framed as “routine” without trend data.
3. Has the Optical Engine Been Opened or Internally Cleaned?
Why it matters: Improper field cleaning can disturb micron-level alignment or damage AR coatings.
- Acceptable answer: Optical head never opened outside authorized factory service; documented controlled-environment maintenance.
- Red flag: Internal cleaning performed without manufacturer protocol; vague description of “optics wiped” or “dust removed” without documentation.
4. What Was the Clinical Throughput Environment?
Why it matters: Systems used in high-volume screening centers accumulate significantly more fatigue cycles than low-volume specialty clinics.
- Acceptable answer: Clear description of usage profile (e.g., ~40 patients/day); consistent with moderate duty cycle.
- Red flag: Prior use in 150–250 patients/day screening workflow without shortened service interval or component replacement.
5. Can a Mechanical Repeatability Test Be Performed Before Purchase?
Why it matters: Mechanical artifacts are position-locked and reproducible. A stable phantom scan reveals scanner non-linearity.
- Acceptable answer: Seller allows repeated phantom scans; geometric consistency demonstrated across acquisitions.
- Red flag: Demonstration limited to a single high-quality image; reluctance to perform repeatability testing.
Used OCT Evaluation Summary
| Evaluation Area | Positive Indicator | Warning Sign |
|---|---|---|
| Operating hours | Documented, within service life | Unknown or near EOL |
| Calibration trend | Stable over time | Increasing adjustment frequency |
| Optical integrity | Factory-sealed history | Undocumented internal access |
From an engineering standpoint, purchasing a used OCT system should be approached as evaluation of a precision measurement instrument — not simply acquisition of imaging equipment. Fatigue history, contamination exposure, and calibration stability determine whether the system will remain reliable for years or begin drifting within months.
📋 Engineering Checklist: 5 Critical Points When Inspecting a Used OCT System
Save or print before equipment evaluation.
1. SLD Endurance Test
Action: Power on the system and allow it to operate for 15–20 minutes before evaluation.
What to observe: Does scan brightness remain stable after warm-up?
Engineering rationale:
A degraded superluminescent diode (SLD) may produce acceptable output when cold. As junction temperature increases to operating level, output power can decline and noise increases, reducing effective SNR. Warm-state performance is what determines clinical stability.
2. Background Noise Evaluation
Action: Perform a scan without a patient (test eye or air scan, if system architecture allows).
What to observe: Excessive speckle or “snow” in dark regions of the image.
Engineering interpretation:
If acceptable contrast requires maximum gain or brightness compensation, the light source may be approaching end-of-life or the optical path may be contaminated. Digital gain does not restore lost coherence amplitude.
3. Mechanical Acoustic Test
Action: Initiate a wide-field scan sequence.
What to observe: Whining, metallic scraping, intermittent oscillation noise.
Engineering assessment:
Galvanometric scanners and cooling fans should produce a smooth, stable acoustic profile. Metallic tonal artifacts often indicate bearing wear or torsion imbalance, which later manifests as scan edge distortion or stair-stepping artifacts.
4. System Hardware Verification (PC & Interface Boards)
Action: Inspect system specifications and rear-panel hardware.
What to verify: Presence of proprietary interface or capture boards.
Critical question to seller:
“Are original installation media and drivers available for these specific boards?”
Engineering concern:
Without original drivers, migration to replacement hardware becomes impossible if the current PC fails. This is a common secondary-market risk.
5. Database Examination Count
Action: Check total number of completed examinations stored in the system database.
Engineering interpretation:
While OCT systems do not include a mechanical odometer, examination count is a reasonable proxy for duty cycle exposure.
Systems exceeding 20,000–30,000 exams likely operated in high-throughput environments and warrant closer mechanical and optical inspection.
Why This Matters
This checklist shifts evaluation from cosmetic inspection to functional engineering assessment. Used OCT systems should be treated as precision interferometric instruments, not generic imaging devices.