Optical Coherence Tomography Angiography (OCTA) is commonly presented as a dye‑free method for visualizing retinal and choroidal microvasculature. Clinically, the discussion often centers on image sharpness, segmentation accuracy, and quantitative flow metrics. Yet every OCTA map is the result of tightly coordinated optical emission, interferometric detection, mechanical beam steering, and high‑throughput signal processing. The vascular image is not captured — it is reconstructed from time‑dependent signal variation.
Because OCTA is fundamentally a motion‑contrast technique, its reliability is governed by temporal precision. In this section, I focus on scan speed as the primary hardware parameter that defines how much physiologic motion can be separated from unwanted eye movement before the signal becomes ambiguous.
Scan Speed — Why 100,000+ A‑Scans per Second Became the Practical Standard
Unlike structural OCT, OCTA requires repeated B‑scans at the same retinal location to calculate decorrelation between sequential measurements. The system must therefore sample the same tissue volume multiple times within a short temporal interval. If acquisition is too slow, involuntary eye motion competes directly with erythrocyte movement, and the algorithm cannot reliably distinguish between the two.
Vision Support: Quality AREDS 2 Formula eye vitamins can be found on Amazon.
Retinal capillary diameters are typically reported in the range of approximately 5–10 µm in anatomical references of the human retina. In many commercial 3×3 mm OCTA protocols, the lateral sampling interval is on the order of 10 µm, depending on scan density. This means that a microsaccade comparable to a single sampling step can shift a capillary from one sampling column to the next. When decorrelation is calculated, the system interprets this displacement as signal change. At this spatial scale, motion artifact is not a software flaw — it is a geometric consequence of sampling.
Clinically Deployed A‑Scan Rates
Concrete reference values are provided by current clinical platforms:
- ZEISS CIRRUS 6000 — 100,000 A‑scans per second (manufacturer technical specifications).
- Topcon DRI OCT Triton — 100,000 A‑scans per second (manufacturer technical specifications).
- ZEISS PLEX Elite 9000 — 100,000 A‑scans per second in its standard clinical configuration (manufacturer technical specifications).
The clustering of major clinical systems around ~100 kHz is not arbitrary. At this rate, a standard 3×3 mm OCTA volume can typically be acquired within a few seconds under common commercial scan densities. From an engineering perspective, this duration lies near the practical fixation limit for many patients without active tracking.
It is important to recognize that increasing A‑scan rate does not automatically translate into proportionally faster or cleaner angiography. The mechanical scanning system — typically galvanometric mirrors or MEMS scanners — must follow the commanded trajectory without phase lag. If mechanical bandwidth becomes the limiting factor, geometric distortion and phase instability increase, directly affecting angiographic repeatability. In wide‑field OCTA, scanner inertia can become as important as laser speed.
Interscan Time and Flow Sensitivity
A key temporal parameter in OCTA is the interscan time — the delay between repeated B‑scans at the same retinal position. This interval determines which flow velocities produce measurable decorrelation.
Expert Choice: Recommended by eye care professionals for managing dry eyes, styes, and blepharitis, this Heated Eye Mask provides the consistent moist heat therapy endorsed by the American Academy of Ophthalmology. It’s an effective, reusable solution for soothing irritation and improving oil gland function. Available on Amazon.
Published OCTA protocol analyses report interscan times in the range of several milliseconds. For example, Kaizu et al. (Ophthalmology Science, 2022) evaluated interscan intervals approximately between 4 and 9 ms in clinical diabetic retinopathy imaging. Variable interscan time analysis (VISTA) implementations have reported shorter separations of approximately 1.5–3.0 ms for comparative flow assessment (Ploner et al., IOVS, 2016).
These values illustrate a fundamental compromise:
- Shorter interscan times reduce total acquisition duration and improve motion robustness.
- Longer interscan times increase sensitivity to slower capillary flow but extend vulnerability to bulk eye movement.
There is another layer to this compromise that is rarely discussed outside engineering circles: detector noise and digitizer precision. If the interscan interval is shortened excessively, the decorrelation signal approaches the noise floor of the detection chain. In that regime, angiographic contrast becomes dominated by electronic and shot noise rather than true flow. Thus, interscan timing is constrained not only by motion but also by signal‑to‑noise stability.
Because interscan time is directly tied to A‑scan rate and B‑scan density, scan speed becomes the lever that allows physiologically meaningful timing without unacceptable exposure to motion.
Specialized Care: For persistent itching or flaking, eye care specialists recommend targeted formulas like this BetterLids Eyelid Ointment . This preservative-free, dermatologist-tested oat complex is a top choice for soothing sensitive skin and managing symptoms of blepharitis. Available for easy ordering on Amazon.
Engineering Trade‑Offs of High‑Speed Sources
Achieving 100,000 A‑scans per second or higher depends on light source and detection architecture.
Spectral‑domain OCT systems for retinal imaging typically use broadband superluminescent diodes centered near 840 nm, as specified in commercial SD‑OCT documentation. Swept‑source systems commonly operate near 1,050 nm, as specified for devices such as the Topcon DRI OCT Triton and ZEISS PLEX Elite 9000, where the longer wavelength improves choroidal penetration.
Increasing sweep frequency or camera line rate introduces several engineering constraints:
- Reduced integration time per A‑scan, which can decrease sensitivity if optical power and detector performance are not adjusted accordingly.
- Increased thermal and mechanical stability requirements in swept laser cavities at higher repetition rates.
- Higher digitizer bandwidth and real‑time processing demands to prevent data bottlenecks.
In practice, scan speed defines the temporal envelope within which OCTA algorithms operate. If hardware timing, mechanical response, and signal integrity are not balanced, no post‑processing method can fully restore vascular information that was not coherently acquired. In the following section, I examine how eye‑tracking systems attempt to stabilize this temporal envelope and where their real engineering limits lie.
Eye-Tracking Systems — Stabilizing a Moving Target
If scan speed defines the temporal envelope of OCTA, eye tracking determines whether the system remains spatially coherent inside that envelope. OCTA does not measure vessels directly; it measures signal variation between repeated scans. In this context, decorrelation — the mathematical difference between sequential OCT signals that indicates motion — becomes highly sensitive to even small fixation shifts.
From an engineering standpoint, ocular motion is not an exception. It is the baseline operating condition.
Why Motion Matters More in OCTA Than in Structural OCT
In structural OCT, lateral displacement primarily produces geometric distortion or local blur. In OCTA, the same displacement produces artificial decorrelation. The system may interpret static tissue as flow or suppress true low-flow vessels.
Typical microsaccades in healthy subjects have amplitudes on the order of 0.1–1.0 degrees of visual angle. On the retina, this corresponds roughly to 30–300 µm, depending on axial length. Even fixation drift between microsaccades may reach several micrometers per second. When we compare these values to typical OCTA lateral sampling intervals of approximately 5–15 µm in dense 3×3 mm scans, the scale mismatch becomes obvious.
Here I want to emphasize a practical engineering reality: a single microsaccade can shift the beam position by tens of sampling intervals. Even slow drift can shift the beam by one full sampling step between repeated B-scans. In structural imaging this appears as blur. In OCTA it appears as flow.
In glaucoma or early diabetic retinopathy, capillary flow may already be reduced. If motion-induced decorrelation exceeds flow-induced decorrelation, slow-flow vessels fall below the detection threshold. This is not a theoretical concern — it directly affects vessel density metrics used in early disease monitoring.
Tracking Latency and Mechanical Response
Tracking accuracy alone is insufficient. Latency is equally critical.
A typical B-scan acquisition time in 100 kHz systems, depending on A-scan density (for example 300–500 A-scans per B-scan), is on the order of a few milliseconds. If tracking detection and correction latency approaches this timescale, beam correction becomes retrospective rather than preventive.
In practical system design, effective stabilization requires:
- Motion detection in sub-millisecond to low-millisecond range.
- Beam steering bandwidth sufficient to follow eye motion (galvanometric scanners commonly operate with mechanical bandwidths in the tens to low hundreds of Hz).
- Tight synchronization between tracking feedback and OCT acquisition clocks.
I want to point out a failure mode that is rarely mentioned in brochures: clock desynchronization or buffering delay between tracking module and OCT acquisition engine. Even small phase offsets can introduce subtle geometric distortions that are almost invisible in structural B-scans but produce measurable bias in angiographic maps.
During long-term system operation, mechanical components such as galvanometric mirrors may exhibit calibration drift or minor alignment shifts. While this may not immediately degrade structural image quality, OCTA repeatability can deteriorate because decorrelation analysis amplifies small spatial inconsistencies.
Slow Flow Sensitivity and Multi-Frame Strategies
As previously discussed, interscan time determines which flow velocities generate measurable decorrelation. Published OCTA protocol analyses report interscan intervals on the order of several milliseconds, with values such as approximately 4–9 ms in clinical implementations (Kaizu et al., 2022) and approximately 1.5–3.0 ms in variable interscan research protocols (Ploner et al., 2016).
Short interscan intervals favor motion robustness. Longer intervals favor sensitivity to slower flow.
Vendors address slow-flow detection using several engineering strategies:
- Repeating more than two B-scans per position (three or four repeats instead of two).
- Applying statistical averaging across multiple decorrelation frames.
- Using split-spectrum processing to improve signal-to-noise ratio.
Adding repeated frames increases sensitivity to slow flow but linearly increases acquisition time. For example, doubling the number of repeated B-scans doubles local acquisition time and proportionally increases exposure to fixation instability.
Another important nuance is noise floor interaction. If the decorrelation interval is shortened excessively, the signal difference between repeated scans approaches detector noise and shot noise limits. In that regime, angiographic contrast becomes noise-dominated. Engineers therefore balance interscan timing not only against motion but also against system SNR performance.
Optical Power, Scan Speed, and Laser Safety Constraints
Increasing A-scan rate reduces integration time per A-scan. To preserve signal-to-noise ratio (SNR), optical power or detector gain must compensate for reduced photon collection time.
However, ophthalmic OCT systems operate under maximum permissible exposure (MPE) limits defined by standards such as ANSI Z136.1 and IEC 60825-1. Clinical retinal OCT systems typically operate with optical power at the cornea on the order of several hundred microwatts to approximately 1–2 mW, depending on wavelength and scan conditions, remaining within safety limits.
This introduces a hard ceiling: sensitivity cannot be increased indefinitely by raising power.
| Constraint | Engineering Limitation | Clinical Consequence |
|---|---|---|
| ANSI / IEC MPE limits | Maximum allowable retinal exposure | Optical power ceiling |
| Reduced integration time at high speed | Fewer photons per A-scan | Lower SNR if not compensated |
| Detector bandwidth expansion | Increased electronic noise | False decorrelation risk |
I want to stress that scan speed and safety compliance are tightly coupled. When moving from 70 kHz to 200 kHz regimes, maintaining equivalent sensitivity requires improvements in detector efficiency, optical throughput, or signal processing — not simply higher laser output.
Spectral-Domain vs. Swept-Source in OCTA — Engineering Perspective
The practical question often asked in procurement is whether swept-source systems (~1,050 nm) provide superior angiography compared with spectral-domain systems (~840 nm), particularly when both operate near 100 kHz.
Recommended Architecture: Spectral-Domain OCTA is typically adequate and cost-efficient.
Recommended Architecture: Swept-Source OCT provides measurable structural advantage.
Recommended Architecture: Swept-Source often advantageous due to more uniform depth performance.
Recommended Architecture: Spectral-Domain platforms typically offer simpler maintenance and lower capital burden.
From an engineering standpoint, several measurable parameters differ:
- Wavelength-dependent scattering and absorption.
- Sensitivity roll-off with imaging depth.
- Phase stability at higher sweep speeds.
- Mechanical and electronic complexity.
| Feature | Spectral-Domain (~840 nm) | Swept-Source (~1050 nm) |
|---|---|---|
| Inner retinal OCTA | Strong performance | Comparable performance |
| Choroidal visualization | Limited penetration | Improved penetration depth |
| Depth sensitivity roll-off | Camera-limited | Typically more uniform with depth |
| Hardware complexity | Simpler source; high-speed camera required | Tunable laser; balanced detection |
For purely retinal angiography, high-speed spectral-domain systems operating at 100 kHz can deliver angiographic quality comparable to many swept-source platforms. The engineering advantage of swept-source becomes more evident when imaging deeper choroidal structures or performing wide-field scans where depth roll-off becomes limiting.
The decision to invest in swept-source technology should therefore be based on depth requirements, field size, and system integration — not on wavelength alone.
In the next section, I examine how computational architecture and processing hardware ultimately determine whether the captured data can be transformed into clinically reliable vascular maps.
Processing Architecture and Algorithmic Transparency — Where Data Becomes Angiography
If optics define signal acquisition and tracking stabilizes spatial position, processing architecture determines what ultimately appears on the screen. In OCTA, the transformation from raw interferometric data to a vascular map involves several computational stages: spectral processing, motion correction, decorrelation calculation, projection artifact suppression, segmentation, and visualization.
At this stage, engineering decisions become less visible to the clinician — and more influential.
Data Throughput and Real-Time Constraints
A 3×3 mm OCTA scan acquired at 100,000 A-scans per second with several hundred A-scans per B-scan and multiple repeated B-scans generates tens to hundreds of megabytes of raw interferometric data within a few seconds, depending on bit depth and repetition strategy. If 16-bit digitization is used — which is typical for OCT detection chains — every A-scan contributes substantial data volume before any compression or processing occurs.
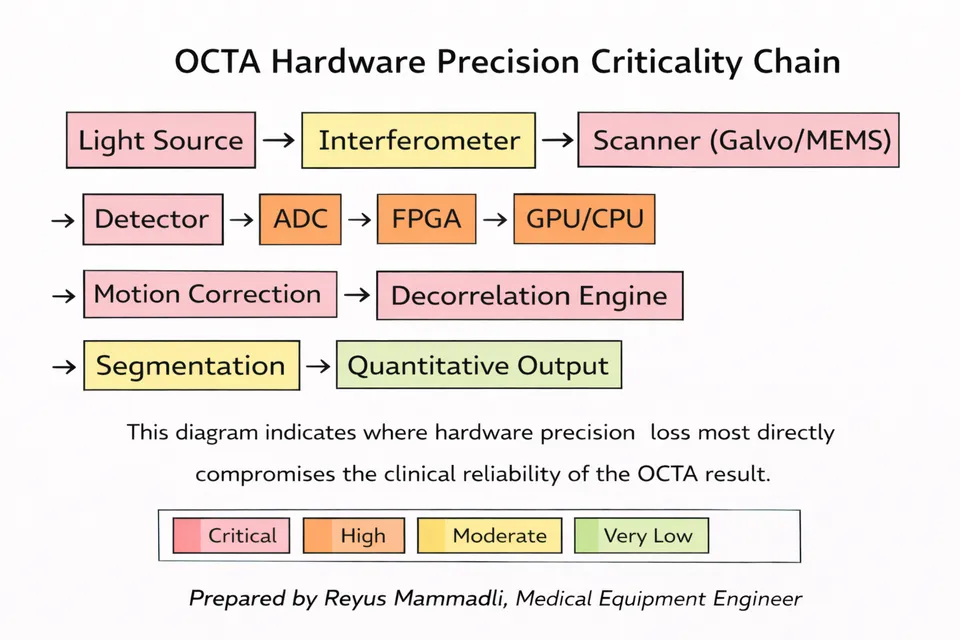
From an engineering perspective, three hardware layers determine whether this data can be handled without loss:
- Analog-to-digital converter (ADC) bandwidth and resolution.
- FPGA or real-time preprocessing capability.
- CPU/GPU computational throughput for volumetric processing.
If buffering or data transfer latency occurs between these stages, phase instability and frame misregistration may appear. I want to emphasize that two systems operating at the same nominal 100 kHz scan rate can demonstrate different repeatability simply because their internal data pipelines are architecturally different.
Line rate: ≥100 kHz A-scans
Bandwidth requirement: 200–500 MB/s raw stream
Risk: Insufficient sampling precision → quantization noise → false decorrelation.
Required latency: sub-millisecond
Buffer depth: critical for continuous acquisition
Risk: Buffer overflow or timing jitter → phase misalignment between repeated B-scans.
Processing load: decorrelation + motion correction + segmentation
Parallel GPU architecture preferred for real-time output
Risk: Asynchronous processing or queue delay → interscan timing inconsistency.
Even microsecond-scale offsets may alter phase-sensitive OCTA calculations.
Engineering Principle: Throughput consistency is as critical as scan speed.
The “Black Box” Problem — Proprietary Post-Processing
Most commercial OCTA platforms implement proprietary processing pipelines. While foundational approaches such as split-spectrum amplitude decorrelation or phase-variance analysis are described in literature, the exact filtering, thresholding, and projection-removal strategies are typically undisclosed.
This creates a practical issue: aggressive noise suppression can remove not only speckle noise but also true low-flow capillaries. Conversely, conservative filtering may preserve noise that artificially elevates vessel density metrics.
From an engineering standpoint, post-processing usually includes:
- Spatial filtering (often Gaussian or median-based).
- Intensity normalization.
- Projection artifact removal algorithms.
- Binary thresholding for vessel density quantification.
Each of these steps contains adjustable parameters. When thresholds are tuned aggressively to improve visual cleanliness, the system may sacrifice microvascular sensitivity.
| Processing Stage | Engineering Parameter | Potential Clinical Effect |
|---|---|---|
| Spatial filtering | Kernel size | Loss of fine capillaries if oversized |
| Projection removal | Depth compensation model | Under- or over-suppression of deeper vessels |
| Thresholding | Intensity cutoff value | Artificial vessel density variation |
I want to underline an important point: two devices may produce visually similar angiograms while reporting different quantitative vessel density values. The difference may originate not from optics, but from proprietary segmentation and threshold logic.
Synchronization and Repeatability
Earlier, I mentioned clock synchronization between tracking and acquisition subsystems. Processing introduces another synchronization layer.
OCTA requires precise temporal alignment between repeated B-scans. If internal buffering, GPU queuing, or asynchronous processing pipelines introduce timing jitter, decorrelation calculations may compare signals that are not perfectly phase-aligned.
Even microsecond-scale inconsistencies can alter phase-sensitive calculations in high-speed systems. Over time, firmware updates or driver changes can subtly modify processing latency. Clinically, this may appear as reduced inter-visit repeatability without any obvious hardware malfunction.
This is why nominal specifications — such as “100,000 A-scans per second” — are insufficient to predict real-world repeatability. System-level synchronization architecture matters.
Ease of Use as an Engineering Parameter
Ease of use is often described as a marketing feature. From an engineering perspective, it is a control-system design problem.
An OCTA system must guide the operator to:
- Achieve adequate centration.
- Maintain fixation stability.
- Select appropriate scan density.
- Avoid segmentation misalignment.
If user interface design requires multiple manual adjustments or complex workflow navigation, operator variability increases.
This variability directly affects:
- Scan quality index.
- Motion artifact rate.
- Segmentation accuracy.
- Quantitative reproducibility.
In other words, interface architecture influences measurement variance. A technically advanced platform with suboptimal workflow design may underperform in daily practice compared with a slightly less sophisticated but ergonomically optimized system.
| Interface Factor | Engineering Consideration | Operational Impact |
|---|---|---|
| Alignment feedback | Real-time quality metrics | Reduced motion artifacts |
| Automated segmentation | Model robustness | Lower operator dependency |
| Workflow steps | Number of manual inputs | Reduced variability |
Computational Limits of “AI” in OCTA
Many systems now incorporate AI-based segmentation or artifact suppression. From an engineering standpoint, these models operate on previously processed OCT or OCTA volumes. They do not replace physical acquisition constraints.
If signal-to-noise ratio is inadequate or motion distortion exceeds correction capacity, AI cannot reconstruct missing vascular information. It can only interpolate or statistically infer.
Therefore, computational sophistication enhances robustness but does not eliminate hardware limitations.
Integration — When Architecture Determines Clinical Value
OCTA performance is not defined by a single parameter. It is the product of:
- Scan speed and temporal precision.
- Tracking latency and mechanical bandwidth.
- Optical power within safety limits.
- Data pipeline architecture.
- Post-processing transparency.
- Operator-interface design.
When these elements are balanced, angiographic maps become repeatable and quantitatively meaningful. When one element dominates — for example aggressive filtering to compensate for weak SNR — apparent image quality may improve while quantitative reliability declines.
For clinicians and procurement specialists, understanding this integration is more informative than comparing headline specifications. In OCTA, engineering architecture determines whether the image represents physiology — or merely processing interpretation.
Engineering Questions to Ask Before Purchasing an OCTA System
When evaluating OCTA platforms, brochures typically emphasize scan speed, wavelength, and image appearance. However, several engineering-level questions provide deeper insight into long-term reliability, repeatability, and true performance. Below are five questions I recommend asking vendors directly.
1. What is the effective interscan time and how many repeated B-scans are used per position in standard OCTA protocols?
Why this matters: Interscan timing and frame repetition directly determine sensitivity to slow capillary flow and exposure to motion artifacts.
- Positive indicator: The vendor provides specific values (e.g., 3–6 ms interscan interval, 2–4 repeated B-scans per position) and explains how timing can be adjusted for different clinical scenarios.
- Red flag: The answer focuses only on total scan time or image quality without specifying repetition strategy or timing parameters.
2. How is motion correction implemented — hardware tracking, software registration, or both — and what is the correction latency?
Why this matters: Low-latency hardware tracking significantly improves angiographic repeatability compared with purely retrospective software correction.
- Positive indicator: The vendor specifies the tracking architecture (e.g., integrated SLO-based tracking), describes real-time correction, and provides latency or update frequency data.
- Red flag: The vendor states that “software corrects motion” without describing detection method, timing reference, or synchronization.
3. What is the detector bit depth and how is raw interferometric data processed (ADC resolution, FPGA preprocessing, GPU acceleration)?
Why this matters: Bit depth and processing architecture influence noise floor, decorrelation precision, and quantitative repeatability.
- Positive indicator: Clear specification (e.g., 12–16 bit digitization, dedicated FPGA pipeline, GPU-based volumetric reconstruction) with explanation of how data integrity is maintained.
- Red flag: No information about digitization depth or processing pipeline; emphasis placed only on final image appearance.
4. How does the system maintain optical sensitivity while remaining within ANSI / IEC laser safety limits at high scan speeds?
Why this matters: Increasing scan speed reduces integration time per A-scan. Maintaining signal-to-noise ratio without exceeding safety limits requires optimized optical efficiency and detector performance.
- Positive indicator: Vendor explains optical power levels at the cornea, compliance with ANSI Z136.1 / IEC 60825-1, and describes sensitivity optimization strategy.
- Red flag: Claims of “higher power” or “stronger signal” without explicit reference to safety compliance and exposure limits.
5. Which components most commonly require service or replacement, and what is the expected service life of key subsystems (light source, scanner, detector)?
Why this matters: Long-term cost of ownership depends on durability of tunable lasers, SLD modules, galvanometric scanners, and high-speed cameras.
- Positive indicator: Vendor provides expected operating hours for the light source, calibration intervals for scanners, and transparent service schedules.
- Red flag: Vague statements such as “minimal maintenance required” without quantified service life or replacement cost guidance.
These questions move the evaluation process beyond image aesthetics and toward engineering architecture, reliability, and long-term clinical stability.
The Pre-Owned OCTA Checklist — Engineering Due Diligence
Purchasing pre-owned or refurbished OCTA equipment is always a balance between cost and reliability. In angiography, this balance is particularly critical. OCTA places significantly higher demands on hardware stability, signal-to-noise ratio, and mechanical precision than standard structural OCT.
If a refurbished system is under consideration, technical due diligence should include the following engineering checks.
1. Light Source Stability and Power Reserve
Superluminescent diodes (SLD) in spectral-domain systems and tunable lasers in swept-source platforms have finite operational lifetimes. Over time, output power decreases and spectral characteristics may drift.
How to verify: Request a service report documenting current laser drive current and compare it with the original factory specification. If drive current has been significantly increased to maintain nominal output power, the light source may be approaching end-of-life.
Clinical risk: Reduced optical power reserve elevates the system noise floor. In OCTA, this disproportionately affects low-flow capillaries, which may disappear into noise-dominated regions.
2. Galvanometric Scanner Wear (Mechanical Jitter)
Galvanometric mirrors are precision electromechanical components. In pre-owned systems, bearing wear, coil fatigue, or minor alignment shifts may not be visually apparent but can introduce micro-instability.
How to verify: Perform a repeatability test by scanning the same stable subject or phantom five consecutive times using identical parameters. If vascular maps show geometric inconsistency, stepped boundaries, or variable vessel thickness, mechanical instability is likely.
Clinical risk: Even microscopic mechanical jitter is interpreted by the decorrelation algorithm as motion. The result is angiograms contaminated by motion-induced noise that cannot be fully corrected in software.
3. Optical Path Contamination — Internal Haze and Coating Degradation
Dust accumulation or degradation of internal optical coatings is common in aging systems and is often invisible during external inspection.
How to verify: Acquire a background or “noise” scan without a patient. Stationary vertical bands, fixed speckle clusters, or localized intensity dropouts may indicate contamination within the optical path.
Clinical risk: Any attenuation or scattering within the beam path reduces dynamic range. In OCTA, this may generate artificial non-perfusion areas that mimic true capillary dropout.
4. Cooling and Thermal Management Integrity
High-speed detectors, FPGAs, GPUs, and swept lasers generate substantial heat. In older systems, heat sinks may be obstructed by dust and thermal interface materials may have degraded.
How to verify: Perform a stress test by acquiring 10–15 consecutive OCTA scans. Monitor processing time, error messages, or unexpected scan interruptions. Increasing processing latency over repeated scans may indicate thermal throttling.
Clinical risk: Elevated sensor temperature increases thermal noise and reduces phase stability. In OCTA, this directly compromises decorrelation accuracy.
5. Software Version vs. Hardware Generation Compatibility
Resellers sometimes install the latest software version on older hardware platforms without verifying computational headroom.
How to verify: Confirm that CPU model, GPU capability, and RAM capacity meet the minimum specifications for the installed software version. Review manufacturer documentation for required hardware configuration.
Clinical risk: Insufficient processing capacity can lead to dropped tracking frames, delayed motion correction, or incomplete volumetric reconstruction — resulting in severe artifact load and poor repeatability.
In refurbished OCTA systems, hardware fatigue and architectural mismatch are far more consequential than cosmetic wear. A structured engineering inspection reduces the likelihood of acquiring a device that produces visually acceptable but quantitatively unreliable angiography.
References
- ZEISS. Product specifications and technical documentation for CIRRUS 6000 and PLEX Elite 9000 OCT systems. Available from: https://www.zeiss.com
- Topcon Healthcare. Product specifications and technical documentation for DRI OCT Triton swept-source OCT system. Available from: https://topconhealthcare.com
- American National Standards Institute (ANSI). ANSI Z136.1 – American National Standard for Safe Use of Lasers. Available from: https://www.ansi.org
- International Electrotechnical Commission (IEC). IEC 60825-1 – Safety of laser products. Available from: https://www.iec.ch
- Kaizu Y, et al. Interscan time analysis in OCT angiography for detection of slow capillary flow. Ophthalmology Science, 2022. Journal information available from: https://www.journals.elsevier.com/ophthalmology-science
- Ploner SB, et al. Variable interscan time analysis (VISTA) in OCT angiography. Investigative Ophthalmology & Visual Science (IOVS), 2016. Journal information available from: https://iovs.arvojournals.org
- American National Standards Institute / Laser Institute of America. Laser safety framework relevant to ophthalmic imaging systems. Available from: https://www.lia.org
- Drexler W, Fujimoto JG (eds.). Optical Coherence Tomography: Technology and Applications. Springer. Publisher information available from: https://www.springer.com
- Huang D, Swanson EA, Lin CP, et al. Optical Coherence Tomography. Science. American Association for the Advancement of Science. Journal information available from: https://www.science.org
- General anatomical and histological references on human retinal capillary dimensions. For example: Hogan MJ, Alvarado JA, Weddell JE. Histology of the Human Eye. Publisher information available from: https://www.wiley.com