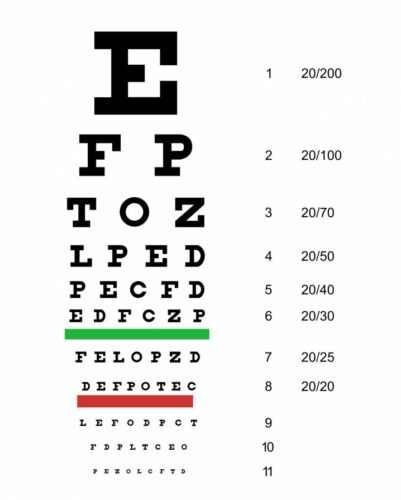
The Snellen Eye Chart was developed in 1862 by Dutch ophthalmologist Dr. Herman Snellen. It’s a common tool for gauging visual acuity in clinics, universities, and other settings.
The 11 rows of these block letters gradually become smaller and more numerous as you go down the chart. In this particular table, we use the letters C through Z. Patients are asked to cover one eye and read the letters aloud, starting at the top row.
The narrowest row of readable letters is used to assess the patient’s visual acuity in their exposed eye. Normal human vision is defined as 20/20, and other results are also represented as fractions.
Vision Support: Quality AREDS 2 Formula eye vitamins can be found on Amazon.
Types of Eye Charts
Eye charts are crucial for assessing a patient’s visual acuity during eye exams. Several types of eye charts are used for different purposes by eye care practitioners.
The Snellen eye chart, developed in the 1860s by Dutch ophthalmologist Herman Snellen, is the most common and well-known kind of eye chart. This graph is made up of rows of progressively smaller capital letters.
Snellen created a chart called the “Tumbling E” for babies and those who can’t read yet. The capital letter E is shown in this graphic in many different orientations.
The Landolt C chart, developed by Swiss ophthalmologist Edmund Landolt, is well suited for illiterate or silent patients because of its use of broken ring symbols presented in a variety of orientations.
The National Eye Institute and the Food and Drug Administration both officially acknowledge the ETDRS chart as the gold standard for measuring visual acuity.
Expert Choice: Recommended by eye care professionals for managing dry eyes, styes, and blepharitis, this Heated Eye Mask provides the consistent moist heat therapy endorsed by the American Academy of Ophthalmology. It’s an effective, reusable solution for soothing irritation and improving oil gland function. Available on Amazon.
How to Use the Snellen Eye Chart
- Set your sights: Face a Snellen chart, which has 11 rows of progressively smaller capital letters, from a distance of 20 feet. Provide adequate overhead lighting or expose the chart to plenty of natural light.
- Put on your glasses or contacts if you need them to prepare your eyes. The alternative is for you to try going glasses-free. Begin by covering one eye with your palm or a simple occluder.
- The examination will begin now. The shortest line of letters that can be seen with the naked eye should be the starting point for your reading.
- Cover one eye with your hand and then the other.
- Evaluate your performance. Visual acuity is measured by how much of a line you can read clearly and is given as a fraction (such as 20/20). To have 20/20 vision, or normal vision, means that your eyesight is identical to that of an ordinary person at a distance of 20 feet.
It’s important to have an in-depth eye exam and have your Snellen chart findings interpreted by a trained practitioner.
Download the chart in PDF for free.
Using Snellen Charts for Vision Testing
The standard Snellen chart consists of 11 rows of capital letters, with progressively smaller characters in the lower rows. Each eye is tested independently from 20 feet away, and the subject reads the tiniest line they can see. At 20 feet away, a person with normal vision will be able to read the chart at the same level as everyone else. Snellen chart results are still used in eye examinations because of their value in diagnosing and treating eye disorders and refractive problems.
You can download Snellen Chart in PDF format (for printing) from here.
International Standards for Vision Testing
Using rows of increasingly large letters or symbols termed optotypes, this standardized test tests visual acuity at different distances. Bailey-Lovie and ETDRS charts, for example, were created to address some of the issues with the Snellen chart, but they have not been generally accepted in clinical practice. Those who are illiterate or unfamiliar with the Roman alphabet have the option of using other charts like the tumbling E test, the Landolt C, or the cracked ring chart.
The Snellen Eye Test Chart is still the gold standard for measuring eye sight across the world.
Limitations of the Snellen Eye Chart
- The Snellen chart primarily tests visual acuity, but it does not evaluate essential skills like eye movement, eye teaming, and focusing, all of which are crucial for academic and everyday success but cannot be detected by the chart.
- Because there are only nine letters total (C, D, E, F, L, O, P, T, and Z) on the chart, there is a limited selection of possible optotypes.
- Different rows and columns on the Snellen chart are spaced at different distances from one another, which can distort the results of the test.
- Uneven Sizing: The test’s reliability may be further undermined by the fact that charts’ font sizes may vary.
- Since the letters and rows on the Bailey-Lovie and ETDRS charts are evenly spaced, they are more reliable than the Snellen chart, which has unequal spacing.