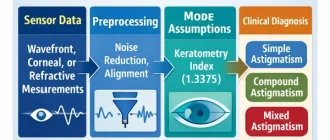
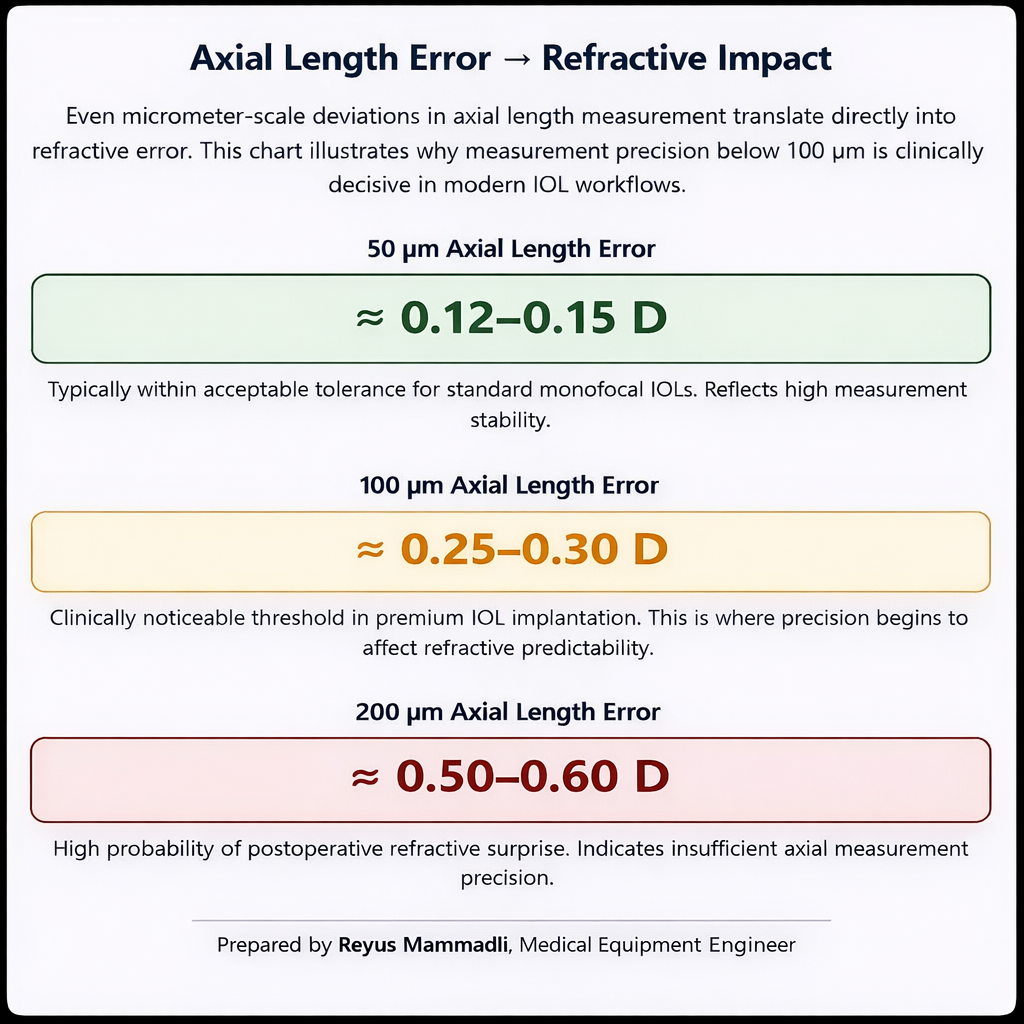
Modern cataract surgery no longer tolerates biometric uncertainty that was acceptable twenty years ago. An axial length error of 100 µm corresponds roughly to 0.25–0.30 D refractive error in an average eye, depending on the IOL formula used. When premium toric or multifocal lenses are implanted, this margin becomes clinically visible. The purpose of this analysis is to examine, from an engineering standpoint, why swept-source OCT (SS-OCT) is technically displacing partial coherence interferometry (PCI) in optical biometry. The discussion focuses on measurable parameters: wavelength, signal-to-noise ratio, detection architecture, sampling density, motion sensitivity, and segmentation reliability.
I approach this not from a marketing perspective, but as a medical equipment engineer trained in biotechnical systems. The key question is simple: what exactly is being measured, how stable is that measurement, and where are the physical limits of the system?
A Change in Measurement Architecture
PCI-based biometers introduced in the late 1990s represented a major improvement over ultrasound A-scan by eliminating corneal compression and improving repeatability into the range of approximately ±10–20 µm under controlled conditions (manufacturer documentation and early comparative clinical studies). The principle is low-coherence interferometry at ~780 nm using a superluminescent diode (SLD). The system detects peaks corresponding primarily to the corneal vertex and the retinal pigment epithelium (RPE), and axial length is calculated from optical path difference.
Vision Support: Quality AREDS 2 Formula eye vitamins can be found on Amazon.
From an engineering perspective, PCI is fundamentally a one-dimensional ranging system. It does not reconstruct tissue structure. It identifies reflectivity maxima and assumes correct boundary correspondence.
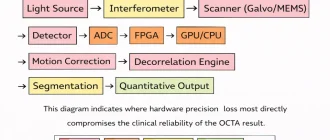
Swept-source OCT changes the acquisition principle. Instead of mechanically matching optical path lengths, a tunable laser sweeps across a wavelength band (typically centered at 1050–1060 nm), and depth information is encoded in the interference spectrum. A Fourier transform reconstructs the full axial reflectivity profile (A-scan). In practical systems, sweep rates commonly reach 50–100 kHz, as specified in contemporary device technical sheets.
The critical distinction is this: PCI detects isolated peaks; SS-OCT reconstructs structure. That structural context becomes decisive when signal quality degrades or anatomy is atypical.
Signal-to-Noise Ratio and Penetration Depth
Wavelength Selection: 780 nm vs 1050–1060 nm
Traditional PCI operates near 780 nm. At the time of its adoption, this wavelength offered stable SLD availability, mature semiconductor fabrication (primarily Germany and Japan), and acceptable ocular transmission.
However, scattering in biological tissue decreases as wavelength increases within the near-infrared window. In dense nuclear cataracts, scattering at 780 nm becomes a dominant limitation. At ~1050 nm, the reduced scattering coefficient is lower, allowing deeper penetration through opacified crystalline lenses. This behavior is described in optical tissue interaction literature and OCT engineering references.
Expert Choice: Recommended by eye care professionals for managing dry eyes, styes, and blepharitis, this Heated Eye Mask provides the consistent moist heat therapy endorsed by the American Academy of Ophthalmology. It’s an effective, reusable solution for soothing irritation and improving oil gland function. Available on Amazon.
Commercial SS-OCT biometers typically operate around 1055 nm with sweep bandwidths on the order of 50–100 nm, according to manufacturer specifications. The longer wavelength is carefully selected to balance three constraints:
- Reduced scattering in dense cataract nuclei
- Acceptable water absorption (which increases beyond ~1100 nm)
- Availability of reliable tunable laser sources (often produced in Japan, Germany, and the United States)
In practical terms, this wavelength shift reduces measurement failure rates in advanced cataracts. Comparative clinical reports consistently show higher acquisition success with swept-source systems in dense lenses.
From an engineering standpoint, the key point is not just penetration depth. It is boundary contrast stability at the RPE. When the RPE peak is poorly defined, axial length segmentation becomes probabilistic. Higher signal strength reduces ambiguity.
A practical example: in eyes with dense brunescent cataracts, PCI systems may display weak or multiple competing peaks. In such cases, operators often repeat measurements several times, hoping for a stable trace. SS-OCT systems, due to higher SNR and structural reconstruction, more consistently display a continuous retinal contour, allowing automated segmentation to confirm the correct boundary.
Specialized Care: For persistent itching or flaking, eye care specialists recommend targeted formulas like this BetterLids Eyelid Ointment . This preservative-free, dermatologist-tested oat complex is a top choice for soothing sensitive skin and managing symptoms of blepharitis. Available for easy ordering on Amazon.
Detection Architecture: Time-Domain vs Frequency-Domain Sensitivity
PCI is a time-domain interferometer. Only one optical path length contributes constructively at a time. Sensitivity is limited because the detector processes depth information sequentially.
Swept-source OCT is a frequency-domain system. All depth information is encoded simultaneously in the spectral interference pattern. Fourier-domain OCT theory demonstrates a sensitivity advantage of approximately 20–30 dB compared to time-domain systems under equivalent optical power conditions (as described in foundational OCT literature).
This sensitivity gain is not theoretical marketing—it directly improves usable signal amplitude at deeper interfaces.
In commercial biometry systems, this translates into:
- Higher effective SNR
- Reduced sensitivity roll-off within the axial range of the human eye
- More stable identification of low-reflectivity boundaries
Sensitivity roll-off describes signal decay with increasing imaging depth. In time-domain systems, amplitude reduction is more pronounced because coherence gating occurs sequentially. In swept-source systems, roll-off still exists due to finite sweep range and detector bandwidth, but within the 20–30 mm ocular range it is generally less limiting.
In my assessment, reduced roll-off is particularly important in long eyes (>26 mm). In high myopia, small segmentation inconsistencies can produce clinically relevant IOL calculation errors. Frequency-domain detection improves signal uniformity across depth, reducing this risk.
Engineering Comparison of PCI and Swept-Source OCT in Optical Biometry
| Parameter | PCI | Swept-Source OCT |
|---|---|---|
| Central wavelength | ~780 nm | ~1050–1060 nm |
| Light source type | Superluminescent diode (SLD) | Tunable swept laser |
| Detection principle | Time-domain interferometry | Frequency-domain (Fourier) detection |
| Penetration in dense cataract | Limited in advanced nuclei | Improved in dense opacities |
| Sensitivity roll-off | More pronounced | Reduced within ocular range |
The architectural shift in detection physics explains most downstream performance differences. Faster electronics alone would not compensate for time-domain limitations.
Another factor that is rarely discussed during procurement is OCT hardware aging. Swept-source systems rely on tunable lasers, MEMS components, precision bearings (in some architectures), and tightly aligned optical paths. Over thousands of operating hours, mechanical fatigue, thermal cycling, and optical drift can influence sweep linearity and signal stability. These engineering aspects directly affect long-term repeatability and calibration stability, which we analyzed in our Deep Dive into OCT Hardware Aging and Optical Lifespan Considerations. Understanding these fatigue points is critical when calculating the true Total Cost of Ownership (TCO) of a biometry platform.
Scan Speed and Motion Artifacts
A-Scan Rate and Acquisition Stability
Typical PCI A-scan rates are on the order of ~2,000 scans per second, according to earlier device specifications. Swept-source biometers commonly operate at 50,000–100,000 A-scans per second, depending on sweep frequency and system configuration.
The engineering implications are significant:
- Shorter acquisition window
- Reduced susceptibility to micro-saccades
- Lower phase instability during measurement
The human eye exhibits constant micro-movements, even during fixation. If acquisition takes longer, motion-induced phase shifts distort peak detection. In time-domain systems, repeated acquisitions are often necessary to confirm stability.
In swept-source systems, high scan rates compress acquisition into a very short temporal window. Clinical repeatability studies frequently report axial length repeatability in the ±5–10 µm range for SS-OCT systems, compared with ±10–20 µm for earlier PCI platforms, depending on patient cooperation and ocular clarity.
A practical case: in elderly patients with unstable fixation or mild nystagmus, PCI measurements may vary between successive scans. Swept-source devices, due to rapid acquisition and structural confirmation of boundaries, typically demonstrate tighter clustering of axial length values.
From a systems engineering perspective, this reduces statistical variance at the first stage of IOL calculation. Reducing variance at the measurement stage prevents error propagation through formula calculations.
Sampling Density and Segmentation Reliability
High A-scan rates enable dense axial sampling. Instead of relying on a limited number of peaks, swept-source systems reconstruct a detailed reflectivity profile across depth.
This allows advanced segmentation algorithms to:
- Identify multiple retinal layers
- Confirm RPE position through pattern consistency
- Detect abnormal profiles (e.g., epiretinal membranes, posterior staphyloma)
- Reject low-confidence scans automatically
Modern biometers include automated quality metrics and confidence scoring, as described in user manuals and technical documentation. While marketing materials often emphasize “AI,” from an engineering standpoint these systems typically combine thresholding, model-based segmentation, and pattern recognition logic.
The advantage is contextual validation. The system does not simply choose the highest peak; it evaluates structural coherence.
In multi-center clinical networks, this reduces operator dependency. When segmentation reliability depends less on manual interpretation, inter-operator variability decreases. That has measurable operational value in high-volume cataract practices.
Scan Speed and Motion Sensitivity in Optical Biometry
| Parameter | PCI | Swept-Source OCT |
|---|---|---|
| Typical A-scan rate | ~2,000 scans/s | 50,000–100,000+ scans/s |
| Acquisition time | Longer | Significantly shorter |
| Motion artifact sensitivity | Moderate | Reduced |
| Axial length repeatability | High | Very high |
From my engineering perspective, scan speed is not a convenience feature. It is a stability parameter. Faster acquisition reduces motion-induced phase errors and strengthens segmentation confidence. In premium IOL workflows, that stability directly supports refractive predictability.
Having examined wavelength physics, detection architecture, and motion-related stability, we have established the signal-level reasons behind the transition from PCI to swept-source OCT. The next step is to analyze how this structural imaging capability extends into corneal measurement, total keratometry, and operator-independent workflows.
Corneal Geometry: Where Optical Biometry Becomes Applied Optical Engineering
Axial length errors are easy to quantify in microns. Corneal errors are more deceptive. The cornea contributes approximately +43 D of the total ~+60 D refractive power of the eye. A 0.25 D corneal power error therefore represents a proportionally significant component of postoperative refractive outcome.
≈ 0.4% of Total Eye Power
From an engineering standpoint, corneal measurement is not just “another parameter.” It is a geometric reconstruction problem with embedded assumptions. If those assumptions are wrong, the error is systematic and will not average out across cases.
Modern swept-source platforms change corneal assessment in two fundamental ways:
- They introduce telecentric optical geometry to stabilize anterior curvature measurement.
- They enable direct posterior corneal measurement, reducing reliance on historical indices.
The practical value of these improvements only becomes clear when we quantify the failure modes of older approaches.
Telecentric Keratometry: Controlling Geometric Error at the Source
Why Working Distance Directly Affects Diopters
In conventional camera-based keratometry, magnification depends on object distance. If the patient moves 1–2 mm relative to the focal plane, the image scale shifts. Even if this change appears negligible, its mathematical consequence is not.
For example:
Average anterior corneal radius ≈ 7.8 mm.
If effective magnification error = 0.5%, calculated radius shifts by ≈0.039 mm.
Using the simplified keratometric formula:
D ≈ (n_k – 1) / r
Where n_k ≈ 1.3375 and r in meters.
A radius change of 0.039 mm results in approximately 0.25 D keratometric power error.
This is not theoretical. It is simple geometry.
In toric IOL planning, 0.25 D misestimation can shift toric step selection. In premium workflows, that shift may determine whether the surgeon selects the next cylinder power increment.
Telecentric optics eliminate magnification variability within a defined working distance tolerance. Chief rays remain parallel, and object distance fluctuations do not alter image scale.
From my engineering perspective, this design reduces one uncontrolled variable in the optical equation. It does not make the system perfect — but it prevents predictable geometric bias.
Where Non-Telecentric Systems Fail in Practice
In elderly patients with limited neck mobility or kyphotic posture, chinrest positioning is rarely ideal. If the patient leans slightly forward during acquisition, conventional systems may register subtly steeper curvature.
In multi-operator environments, I have seen keratometry variability of 0.2–0.4 D between technicians when working distance control was inconsistent. This is not necessarily operator incompetence; it is geometry sensitivity.
Telecentric systems reduce this inter-operator variance. The improvement may not be dramatic in single-case scenarios, but statistically across hundreds of surgeries, it reduces systematic drift.
Telecentric design is not about precision optics elegance. It is about removing a hidden multiplier in the curvature calculation.
Telecentric vs Conventional Keratometry Geometry
| Parameter | Conventional Keratometry | Telecentric Keratometry |
|---|---|---|
| Magnification behavior | Changes with distance | Stable within tolerance |
| 1 mm patient shift impact | Measurable curvature bias | Minimal curvature change |
| Inter-operator variability | Higher | Lower |
| Sensitivity to positioning | Significant | Reduced |
From an engineering risk perspective, telecentricity reduces the probability of systematic geometric error in routine clinical environments.
Standard Keratometry: The Embedded Model and Its Failure Modes
The Keratometric Index Assumption
Standard keratometry measures only the anterior corneal surface and applies a fixed keratometric index (commonly 1.3375). This value approximates posterior surface contribution assuming average anatomy.
This approach embeds three assumptions:
- Posterior curvature has a stable ratio relative to anterior curvature.
- Central corneal thickness is within normal range.
- No refractive surgery has altered anterior geometry disproportionately.
In virgin corneas, the anterior-to-posterior curvature ratio is typically stable. However, after myopic LASIK, anterior curvature flattens while posterior curvature remains largely unchanged. The assumed ratio collapses.
Let us consider a simplified scenario:
Pre-LASIK anterior power: +44.00 D
Posterior contribution (modeled): −6.00 D
Effective total ≈ +38.00 D
After LASIK (true anterior becomes +40.00 D, posterior still −6.00 D):
True total ≈ +34.00 D
If a fixed index assumes proportional posterior flattening that did not occur, calculated total may be overestimated by 0.5–1.0 D depending on ablation depth.
That is the origin of refractive surprise in post-refractive surgery eyes measured with standard keratometry.
This error is systematic. Every similar eye will be biased in the same direction.
Total Keratometry via Swept-Source OCT
Swept-source platforms measure anterior and posterior surfaces directly using tomographic imaging. Posterior curvature is detected from low-reflectivity OCT interfaces, and corneal thickness is measured simultaneously.
Total corneal power can then be calculated using ray tracing or thick-lens formulas instead of a simplified index.
From an engineering standpoint, this removes a model assumption and replaces it with geometry.
However, the quality of this measurement depends on three technical factors:
- Axial resolution of the OCT system (typically ~5–10 µm depending on bandwidth).
- Signal-to-noise ratio at the posterior corneal interface.
- Segmentation algorithm stability.
If posterior boundary detection fluctuates by even 10 µm, curvature estimation may shift meaningfully, especially in steep corneas.
In low-SNR conditions (dry eye, surface irregularity, poor fixation), posterior segmentation may become unstable. The system may still output a number — but the internal confidence score may drop.
Here is where engineering transparency matters. Not all “Total K” values are equal. The robustness of posterior detection determines whether the measurement truly reduces error or simply replaces one assumption with another.
Standard vs Total Keratometry: Engineering Comparison
| Parameter | Standard Keratometry | Total Keratometry (SS-OCT) |
|---|---|---|
| Posterior surface | Assumed via index | Directly imaged |
| Post-LASIK accuracy | Often biased | More anatomically consistent |
| Systematic error risk | High in altered corneas | Reduced if segmentation stable |
| Dependency on OCT SNR | None | Critical |
In toric planning, posterior corneal astigmatism often ranges from 0.2–0.5 D. Ignoring it can misalign toric power selection. Direct measurement reduces this blind spot.
From my perspective, using standard keratometry in post-refractive cases today is knowingly accepting a structural approximation.
Operator Independence and Segmentation: Where Software Becomes the Gatekeeper
From Single Peak Detection to Layer Confirmation
PCI systems primarily identify reflectivity peaks corresponding to corneal and retinal interfaces. If multiple peaks appear, the operator must interpret which one represents the RPE.
Swept-source systems reconstruct a cross-sectional profile. Modern platforms detect:
- Anterior corneal surface
- Posterior corneal surface
- Lens anterior surface
- Lens posterior surface
- RPE layer
These detections use combinations of gradient detection, reflectivity thresholds, and anatomical model fitting.
The key difference is contextual validation. The system evaluates whether detected boundaries align with anatomical plausibility.
For example, if an epiretinal membrane creates an additional reflectivity peak anterior to the RPE, a peak-based PCI system may misidentify it. A structural OCT system can evaluate relative layer spacing and reject implausible configurations.
Where Automation Can Fail
Automation reduces operator variability, but introduces software dependency.
Consider a scenario:
- Dense cataract reduces signal amplitude.
- Posterior corneal boundary becomes noisy.
- Segmentation algorithm selects a slightly anterior boundary.
As established in the previous section, SNR remains the bottleneck for posterior interface stability. When signal amplitude drops, segmentation confidence becomes mathematically fragile rather than clinically obvious.
The system may still produce a Total K value within “acceptable” display range. Unless the operator checks confidence metrics or B-scan visualization, subtle bias may pass unnoticed.
Automation hides complexity. It does not eliminate physics.
Therefore, procurement decisions should evaluate not only feature lists but also:
- Availability of raw B-scan review
- Transparency of confidence metrics
- Calibration procedures after software updates
Operator Dependency: PCI vs Swept-Source OCT
| Parameter | PCI | Swept-Source OCT |
|---|---|---|
| Boundary identification | Peak-based | Layer-based |
| Operator confirmation | Often needed | Rare but still advisable |
| Sensitivity to anatomy anomalies | Higher | Reduced |
| Software dependency | Low | High |
From an engineering governance perspective, SS-OCT shifts risk from human interpretation to software stability and optical calibration integrity.
Where the Real Value Lies
- Telecentric optics reduce geometric bias.
- Total keratometry reduces anatomical assumptions.
- Automated segmentation reduces operator variability.
Each improvement removes one hidden assumption.
But each introduces a technical dependency:
- Optical alignment precision
- OCT signal integrity
- Software version stability
In my assessment, the strength of swept-source biometry in corneal measurement lies in assumption reduction combined with structural validation. When properly calibrated and maintained, it provides a more anatomically faithful representation of corneal optics.
When poorly maintained, poorly calibrated, or blindly trusted, it can still generate systematic errors — just at a higher level of technological complexity.
Understanding these internal mechanisms allows clinicians and clinical engineers to look beyond the device exterior and evaluate what truly determines measurement reliability.
From Measurement Device to Strategic Platform: How Biometry Integrates into the Life of a Clinic
Modern optical biometry cannot be evaluated only at the level of signal physics or geometric modeling. The decisive question for a clinic is how the biometer integrates into the operational, digital, and financial architecture of daily practice.
A modern SS-OCT biometer is no longer an isolated measurement instrument. It is a data-generating node inside a surgical ecosystem. Understanding this transformation is essential for administrators, clinical engineers, and surgeons who evaluate equipment not only by accuracy, but by long-term operational impact.
Data Integrity and Digital Ecosystem: Eliminating Transcription Risk
In older workflows, axial length and keratometry values were manually transcribed from the biometer into the IOL calculation software or directly into surgical planning systems. Every manual step introduces the possibility of transcription error.
A single digit mistake — for example entering 24.38 mm instead of 23.48 mm — can result in a refractive deviation exceeding 1.0 D, depending on the formula and axial length range. This is not a theoretical concern. Human data entry error rates in clinical environments are well documented in health informatics literature.
Modern SS-OCT platforms typically support DICOM connectivity and, in some ecosystems, direct integration into proprietary surgical planning platforms and cloud-based databases. Data can be transmitted automatically to:
- IOL calculation software
- Electronic medical record (EMR) systems
- Surgical microscopes with navigation overlays
From an engineering perspective, removing manual transcription eliminates an entire error vector. The measurement may be correct, but if the data pipeline is fragile, the final outcome remains vulnerable.
I often point out to procurement committees: accuracy is not only a property of optics. It is also a property of data transport.
Closed ecosystems (for example vendor-specific planning platforms) often provide tighter validation and compatibility control. However, they may limit interoperability. Open DICOM-based systems allow flexibility but require careful configuration and IT governance.
The engineering question is therefore not “Is it accurate?” but “How is accuracy preserved across system boundaries?”
Workflow Efficiency: When Stability Converts into Capacity
Earlier we discussed scan speed and repeatability from a signal perspective. Here we translate that stability into operational terms.
If a device requires repeated acquisitions due to borderline signal quality or motion artifacts, each additional scan may consume 30–60 seconds. In a clinic processing 40 cataract patients per day, even an average of 1 extra minute per patient accumulates into nearly 40 minutes of lost capacity daily.
Over one year (assuming 200 surgical days), this corresponds to more than 130 hours of operational time.
Variance reduction is workflow optimization.
When axial length and keratometry are acquired reliably in a single attempt, technician workload decreases, scheduling becomes more predictable, and bottlenecks before the surgical day are reduced.
As an engineer, I look at repeatability not only in microns but in minutes. A system that reduces measurement variance reduces planning uncertainty.
In high-volume centers, this translates directly into higher throughput without increasing staffing.
Total Diagnostic Hub: Integration or Compromise?
Many modern SS-OCT biometers combine axial length measurement, corneal topography, and sometimes anterior segment OCT in a single housing.
At first glance, this seems purely advantageous. One device replaces two or three.
However, integration increases system complexity.
Each optical modality has its own calibration requirements:
- Axial biometry depends on wavelength stability and k-space linearization.
- Corneal topography depends on placido ring projection geometry or Scheimpflug alignment.
- Anterior segment OCT depends on optical path calibration and distortion correction.
When these modalities share a mechanical chassis, thermal drift and alignment tolerances affect multiple subsystems simultaneously.
For example, internal temperature fluctuations may slightly affect swept-laser tuning characteristics. The same temperature shift may alter camera calibration for topography modules.
I always ask vendors: how are independent calibration routines implemented? Are modules recalibrated separately, or is the system treated as one block?
A unified platform simplifies workflow and reduces physical footprint. But it concentrates risk. If one module requires service, the entire diagnostic node may become unavailable.
The engineering evaluation should therefore consider redundancy strategy. Is there backup capacity in the clinic?
Integration is efficient. It is not automatically resilient.
Reliability and Laser Architecture: Complexity Has Consequences
PCI systems traditionally rely on superluminescent diodes (SLDs). These are solid-state emitters with relatively simple architecture and long operational stability under proper thermal management.
Swept-source systems use tunable lasers. Depending on manufacturer design, tuning may involve:
- MEMS-based filters
- Rotating polygon mirrors
- Tunable external cavities
Each of these introduces dynamic components or precision alignment dependencies.
Higher performance comes with tighter tolerances.
Sweep linearity must remain stable for accurate Fourier reconstruction. If k-space linearization drifts, depth scaling errors may appear. While systems include internal calibration references, long-term stability depends on optical and mechanical integrity.
Thermal cycling over years of operation can affect cavity alignment. Bearings in rotating systems (if present) have finite lifespan. Even MEMS components experience fatigue over extremely high cycle counts.
This does not mean SS-OCT is unreliable. It means it is a precision instrument that requires disciplined maintenance.
From a lifecycle engineering standpoint, the question is not “Does it fail?” but “How predictable is its degradation curve?”
Total Cost of Ownership: Engineering Economics Over 5–7 Years
Purchase price represents only a fraction of total cost.
Consider the following components of ownership:
- Annual service contracts
- Downtime risk and lost surgical slots
- Laser module replacement (if required outside warranty)
- Software upgrade licensing
- Calibration verification procedures
Now consider the indirect cost of refractive surprise:
- Additional chair time
- Enhancement procedures
- Reputation impact
Precision reduces downstream corrective cost.
A system that lowers axial variance and posterior corneal error reduces probability of unexpected postoperative refraction.
Even if the difference per case appears small, across hundreds of premium IOL implantations, the financial and reputational impact accumulates.
When I discuss TCO with administrators, I emphasize that engineering stability has monetary expression. Microns translate into diopters. Diopters translate into patient satisfaction. Patient satisfaction translates into referral volume.
Embedded Intelligence: IOL Calculation Inside the Hardware
Modern SS-OCT biometers increasingly incorporate advanced IOL calculation formulas directly into device software, including Barrett Universal II, Hill-RBF, and Kane formulas.
From an engineering perspective, this integration reduces fragmentation of the planning workflow. Measurement and calculation occur within the same calibrated environment.
Some platforms perform internal sensitivity analyses, adjusting IOL selection based on small parameter perturbations.
This is computational risk modeling at the device level.
Instead of a static formula output, the system can evaluate how small measurement variations influence refractive prediction.
Future architectures may increasingly use cloud-updated constants and machine learning models trained on large surgical datasets.
PCI-based systems, being architecturally simpler and older, are less adaptable to such computational expansion.
This is where platform extensibility becomes strategically relevant.
Strategic Perspective: Where PCI Still Fits — and Where It Does Not
PCI remains technically adequate in certain environments:
- Standard monofocal IOL workflows
- Clinics with limited post-refractive surgery population
- Budget-constrained facilities
Its simplicity and mature architecture provide stable, predictable performance within defined boundaries.
However, in premium IOL environments, high-volume centers, and digitally integrated surgical ecosystems, SS-OCT functions not merely as a measuring tool but as a platform.
It reduces assumptions, integrates data pipelines, supports advanced formulas, and connects directly to surgical navigation systems.
In my engineering assessment, the decisive question for a clinic is not whether SS-OCT is more advanced. It is whether the clinic’s surgical ambition and digital infrastructure justify the expanded capability.
Technology does not create strategy. But it can either limit it — or enable it.
That is where the real difference lies.
Engineer’s Checklist: Questions to Ask Before Purchasing an SS-OCT Biometer
When evaluating a high-precision biometry platform, brochures and specification sheets rarely reveal the operational realities that determine long-term value. Below are five engineering-level questions I recommend asking vendors — along with guidance on what constitutes a strong answer and what should be considered a red flag.
1. How is long-term axial calibration verified, and how often is it required?
Why this matters: Axial length errors of 10–20 µm may not be visible in daily workflow, but they directly influence refractive prediction. Calibration drift can occur due to optical path changes, temperature variation, or laser sweep nonlinearity.
Strong signal: The vendor describes a defined calibration protocol, specifies intervals (e.g., annual or usage-based), provides traceable reference standards, and explains how calibration results are logged and documented.
Red flag: The response is vague (“the system is factory calibrated”), or calibration procedures are not clearly defined. Lack of documented verification suggests overreliance on assumed stability.
2. What is the expected service life of the swept laser source, and what are replacement or repair pathways?
Why this matters: Tunable laser modules are core components in SS-OCT systems. Their performance affects sweep linearity, signal stability, and ultimately measurement integrity.
Strong signal: The vendor provides expected operating hour ranges, explains failure modes, clarifies whether the laser is field-replaceable or factory-serviced, and outlines cost structure transparently.
Red flag: No clear information on laser lifespan, no cost estimate for post-warranty replacement, or inability to describe failure detection indicators.
3. How are software updates validated, and can segmentation behavior change after updates?
Why this matters: Automated boundary detection and Total Keratometry depend on software algorithms. Even minor algorithm changes may subtly alter measurement outputs.
Strong signal: The vendor explains version control, change documentation, validation procedures, and whether recalibration is recommended after major updates.
Red flag: Updates are described only as “feature improvements” without technical explanation. No documentation of algorithmic changes or validation protocol.
4. What happens operationally if one module of an integrated diagnostic platform fails?
Why this matters: Combined biometry–topography–OCT platforms concentrate functionality in one chassis. A single module failure may interrupt multiple diagnostic pathways.
Strong signal: Modular service design, ability to isolate faulty subsystems, clear downtime estimates, and availability of loaner or backup options.
Red flag: The entire unit must be removed from service for minor subsystem repair, with unclear turnaround time.
5. How is data integrity ensured during transfer to surgical planning systems?
Why this matters: Measurement accuracy is irrelevant if data integrity is compromised during transmission to EMR or navigation systems.
Strong signal: Documented DICOM compliance, checksum validation, structured integration pathways, and clear IT support protocols.
Red flag: Reliance on manual export/import steps, USB transfers, or loosely defined interoperability claims.
Secondary Market Engineering Audit: Distinguishing “Upgrade Trade-In” from “Hidden Instability”
In the United States, small-to-medium private practices often consider pre-owned SS-OCT biometers as a cost-saving strategy. Some units enter the secondary market because large academic centers upgrade frequently. Others appear because intermittent instability made them operationally unreliable.
From an engineering standpoint, pre-owned optical biometry must be evaluated as a precision measurement instrument — not as office furniture.
Below is a practical field audit framework.
1. Repeatability Stress Test (Synthetic Precision Check)
Why this matters:
Axial length repeatability reflects system stability — including laser sweep linearity, thermal equilibrium, and k-clock synchronization.
Procedure:
After allowing the system to warm up for at least 15–20 minutes (thermal stabilization is critical), perform 10 consecutive axial length measurements on:
- A certified model eye (preferred), or
- A healthy eye with stable tear film.
Strong signal:
- Axial length SD ≤ 10 µm
- Keratometry variation ≤ 0.1 D
These values indicate stable interferometric reconstruction under controlled conditions.
Red flag:
- Axial SD > 15 µm
- Progressive drift during repeated scans
This may indicate thermal instability, early laser degradation, or compromised k-space linearization.
Engineering reality:
Even a 15 µm instability can translate into measurable refractive variability in premium IOL cases.
2. Raw B-Scan Noise Floor Analysis
Why this matters:
Software smoothing can mask instability, but raw signal characteristics reveal the true optical condition.
Procedure:
Display the raw OCT B-scan of the retina.
Increase brightness/gain to examine background signal behavior.
Strong signal:
- Clean background
- No fixed vertical artifacts
- Uniform signal attenuation with depth
Red flag:
- Persistent vertical “ghost” lines
- Fixed-pattern noise
- Uneven banding artifacts
These patterns may indicate sensor degradation, internal reflection from damaged optics, or electronic instability.
Engineering implication:
Reduced Signal-to-Noise Ratio (SNR) will compromise segmentation reliability — especially in dense cataracts where penetration margin is already narrow.
3. Beam Steering and Mechanical Stability (Galvo / Alignment Integrity)
Why this matters:
SS-OCT systems rely on galvanometric beam steering and, in some architectures, motorized positioning assemblies. Mechanical fatigue or bearing wear can introduce phase instability.
Procedure:
Observe automatic alignment behavior. Listen and watch during pupil tracking and scan acquisition.
Strong signal:
- Smooth, quiet alignment
- No excessive searching or oscillation
- Stable tracking without micro-vibrational artifacts
Red flag:
- Audible clicking, high-frequency whine, or vibration
- Repeated “searching” behavior before locking onto fixation
These may indicate worn mechanical components or servo instability.
Engineering implication:
Mechanical jitter introduces phase noise, degrading Fourier reconstruction precision and structural clarity.
4. Service Log Audit (Hidden System History)
Why this matters:
High-end systems maintain internal error logs tracking interrupts and synchronization events.
Procedure:
Request the last 12 months of system error logs or service reports.
Strong signal:
- Low frequency of critical system interrupts
- Clear documentation of any prior service interventions
- No recent unexplained log clearing
Red flag:
- Repeated “Laser Timeout”
- “Galvo Out of Sync”
- Frequent restart events
- Recently cleared logs without documentation
Engineering logic:
Intermittent synchronization errors often precede major component failure. Just like a vehicle’s engine warning light, repeated minor errors signal cumulative stress.
5. Verification of Refurbishment Claims
Why this matters:
“Refurbished” is frequently used as a commercial term. In precision optics, refurbishment has a technical definition.
Ask specifically:
Was the following performed and documented?
- Laser sweep linearity recalibration
- k-clock verification
- Fiber interferometer alignment check
- Laser output power measurement
- Updated calibration certificate with traceable date
Strong signal:
- Written calibration documentation
- Recent service certificate
- Transparent description of replaced components
Red flag:
- Cosmetic cleaning presented as refurbishment
- Software reset without optical recalibration
- No documentation of optical verification
Engineering reality:
A true refurbishment restores metrological integrity. Without calibration validation, the unit remains simply “used.”