When clinicians talk about mixed astigmatism, it is usually framed as a refractive condition of the eye. From an engineering standpoint, however, mixed astigmatism is more accurately described as a measurement outcome produced by a chain of optical hardware, sensors, alignment mechanics, and signal-processing algorithms. I deliberately start from this position because, in practice, what the clinic sees as “mixed astigmatism” often originates not in the eye itself, but in how modern diagnostic devices acquire and interpret optical data.
As a medical equipment engineer, I find this distinction critical. It explains why two reputable devices can disagree on axis orientation or cylinder sign, why repeated measurements on the same patient can drift, and why software updates sometimes “change” astigmatism profiles without any physiological change in the eye.
Mixed Astigmatism as a Device-Derived Result
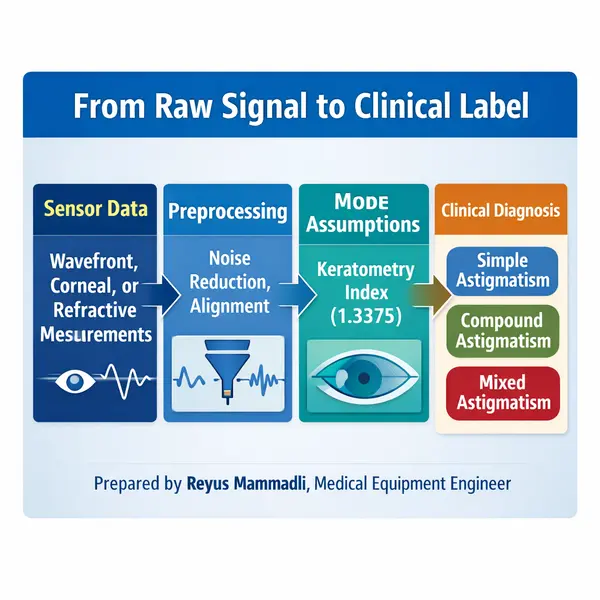
Most diagnostic systems do not directly measure refractive error as a physical object. Instead, they infer it from indirect optical phenomena: image displacement, wavefront deformation, or reflected ring distortion. Mixed astigmatism appears when these inferred values cross zero differently along orthogonal meridians.
From a device perspective, this means mixed astigmatism is not a primary variable. It is a classification state derived from:
- spherical equivalent calculations,
- cylindrical magnitude and sign,
- axis determination,
- internal software thresholds.
This already introduces an engineering vulnerability. Any uncertainty in sign determination (plus vs minus cylinder), axis jitter of even ±3–5 degrees, or noise near the zero-crossing point can flip a result from simple to mixed astigmatism. Engineers tend to recognize this immediately as a boundary-condition problem rather than a diagnostic mystery.
In my experience, mixed astigmatism is disproportionately reported in cases where the signal-to-noise ratio is marginal, fixation is unstable, or multiple optical surfaces contribute competing data.
Autorefractors: Optical Principles and Practical Limits
Autorefractors remain the most common entry point for refractive measurements in U.S. clinics. Most modern units rely on infrared light (typically 820–880 nm) projected into the eye, with reflected images analyzed by CCD or CMOS sensors.
The underlying principle is deceptively simple: project a known pattern, observe its retinal reflection, and calculate refractive error based on displacement. In practice, several engineering details matter:
- Measurement resolution: typical autorefractors operate with spherical resolution around 0.12–0.25 diopters and axis resolution near 1 degree. These numbers look acceptable on paper, but when cylinder power is low or near plano in one meridian, the margin for mixed classification becomes narrow.
- Pupil dependency: effective pupil diameters during measurement are often between 2.5 and 4.0 mm. Variations outside this range change aberration weighting and directly influence cylinder calculations.
- Alignment tolerance: lateral misalignment of 0.3–0.5 mm can already introduce asymmetric aberration sampling, which I have repeatedly seen produce artificial mixed astigmatism readings.
One practical note from the field: autorefractors that use dual-ring or multi-zone analysis tend to be more stable than single-ring designs, but they are also more sensitive to tear film irregularities. This trade-off is rarely mentioned in brochures, but it shows up clearly in real-world repeatability tests.
Keratometry: Surface Measurement vs Optical Reality
Keratometry-based devices measure anterior corneal curvature, usually assuming a simplified refractive index (commonly 1.3375) to approximate total corneal power. From an engineering viewpoint, this is an intentional approximation, not a precise physical model.
Typical keratometers sample between 2 and 3 mm of the central cornea. This limited sampling area introduces two important constraints:
- posterior corneal astigmatism is ignored or estimated,
- peripheral irregularities are excluded by design.
The result is that keratometry often produces “clean” astigmatism values that conflict with autorefractor or subjective findings. Mixed astigmatism appears when anterior surface data suggests one sign, while total refractive behavior suggests another.
I want to emphasize something engineers notice quickly: this is not a failure of keratometry. It is a known modeling limitation. Devices that explicitly display measurement zones and confidence metrics are far more transparent than those presenting single-number outputs.
Corneal Topographers: Dense Data, New Problems
Placido-based and hybrid topographers dramatically increase spatial sampling, often analyzing thousands of points across the corneal surface. On paper, this should improve accuracy. In practice, it shifts the problem from data scarcity to data interpretation.
From a hardware standpoint:
- LED ring uniformity matters more than many expect; brightness drift of even 5–7% can bias curvature reconstruction.
- camera sensor noise becomes relevant when calculating higher-order fits.
From a software standpoint:
- surface smoothing algorithms can suppress clinically relevant asymmetries,
- reference axis selection directly affects astigmatism sign.
In my own evaluations, I have seen the same raw corneal data classified as with-the-rule, against-the-rule, or mixed astigmatism depending on how the software weights central versus paracentral zones. This is not operator error; it is an algorithmic design choice.
Wavefront Aberrometers: When Algorithms Dominate
Wavefront aberrometers, particularly Shack–Hartmann systems, are often perceived as the “gold standard.” They measure wavefront deformation by analyzing spot displacement across a microlens array.
Key engineering parameters include:
- microlens pitch (commonly 150–300 µm),
- sensor dynamic range,
- reconstruction polynomial order (usually Zernike up to 6th or 8th order).
Mixed astigmatism frequently emerges here as a consequence of polynomial fitting. When low-order terms approach zero and higher-order aberrations dominate locally, the reconstructed cylinder can flip sign across meridians.
This is where I often remind clinicians: the device is mathematically correct, but the clinical interpretation may not be straightforward. Engineers are comfortable with this ambiguity; clinicians are understandably less so.
Fixation, Motion, and Repeatability
No diagnostic device operates in a static system. Micro-saccades, tear film breakup (often occurring within 5–10 seconds), and blink artifacts all modulate the optical signal.
From an engineering reliability perspective:
- repeatability within ±0.25 D is considered acceptable,
- axis repeatability within ±5 degrees is common, not exceptional.
Mixed astigmatism classifications often appear at the edge of these tolerances. This is not a bug; it is a reflection of operating near system limits.
One comment from experience: devices that average multiple short acquisitions tend to outperform those relying on a single long capture, even if the latter advertises higher nominal resolution.
Software Logic and Classification Thresholds
Finally, it is important to acknowledge that “mixed astigmatism” is frequently a software label. Thresholds such as ±0.25 D around plano, axis stability criteria, and internal confidence scores determine whether a result is flagged as simple, compound, or mixed.
Engineers designing these systems must balance sensitivity against stability. Push thresholds too tight, and mixed astigmatism becomes overreported. Loosen them, and subtle refractive nuances disappear.
This balance — not the eye itself — explains much of the variability clinicians encounter.
At this point in the article, I have deliberately stayed within the domain of measurement devices and signal interpretation. Correction technologies, device disagreement in clinical workflows, and procurement-relevant engineering trade-offs naturally follow from this foundation and will be addressed as the discussion continues.
Device Disagreement: Quantifiable Reasons Why Instruments Diverge
When different diagnostic devices report different astigmatic profiles for the same eye, the explanation is almost always measurable. From an engineering standpoint, disagreement begins with sampling geometry, sensor resolution, and algorithmic thresholds, not with biology.
For example, most table-mounted autorefractors sample the retinal reflex using an effective pupil diameter of 2.5–3.5 mm. In contrast, Placido-based corneal topographers typically reconstruct curvature over rings spanning up to 6–8 mm. Wavefront aberrometers may analyze wavefront data corresponding to 4–6 mm apertures, depending on software settings.
These differences alone mean that each device is describing a different optical subsystem. Mixed astigmatism frequently appears when one subsystem crosses the zero-cylinder boundary while another does not. This is not ambiguity; it is a predictable outcome of mismatched sampling domains.
From my experience, devices that allow the operator to lock or standardize analysis diameter across measurements show noticeably better cross-device agreement.
Calibration Errors: Numerical Sensitivity of Refractive Systems
Calibration errors become critical precisely because refractive measurements operate near low dioptric values. A shift that would be negligible in higher refractive errors becomes decisive around plano.
During service inspections, I have repeatedly measured reference eye misalignment of 0.2–0.4 mm in devices that had not been recalibrated after transport. This degree of decentration can introduce astigmatic bias on the order of 0.25 D, which is sufficient to reclassify a result as mixed.
Another recurring issue is axial positioning error of the reference eye. An axial offset of ±0.5 mm alters vergence assumptions inside the device firmware. Systems that rely on fixed mechanical stops rather than active alignment feedback are particularly vulnerable.
Thermal drift is another underappreciated factor. Infrared optical assemblies mounted on aluminum carriers can experience focal shifts corresponding to 0.1–0.2 D over temperature changes of 10–15 °C. Devices with internal temperature sensors and software compensation handle this far better than passive designs.
Keratometry: Engineering Consequences of the 1.3375 Model
The keratometric index of 1.3375 is a classic example of an engineering simplification that works statistically, not individually. It collapses anterior and posterior corneal surfaces into a single refractive interface, assuming an average posterior contribution.
In practical terms, posterior corneal astigmatism often ranges between 0.2–0.5 D. When its axis opposes the anterior surface, the simplified model can invert the net astigmatic sign. This is one of the most common mechanical reasons why keratometry-derived values conflict with wavefront or subjective findings.
From an engineering perspective, devices that explicitly measure posterior curvature (for example, Scheimpflug-based systems) reduce this modeling error but introduce others: higher sensitivity to eye motion and longer acquisition times.
I consider systems that at least flag when posterior assumptions dominate the calculation to be better engineered than those that silently apply the constant.
Sensor Architecture and Noise Floors
Sensor choice directly influences astigmatism stability. Many modern autorefractors and topographers use CMOS sensors with pixel sizes in the 3–5 µm range. At this scale, photon noise and tear film scatter become nontrivial.
In low-reflectivity eyes or unstable tear films, signal-to-noise ratios drop, and centroid calculations used for axis determination become noisy. Axis jitter of ±4–6 degrees is common under these conditions and is more than enough to produce mixed classifications in borderline cases.
From a hardware quality standpoint, devices that employ higher bit-depth ADCs (12–14 bit rather than 10 bit) and controlled illumination intensity demonstrate more stable axis outputs, even if their nominal resolution appears similar.
Software Thresholds: Where Engineering Decisions Become Clinical Labels
Mixed astigmatism often emerges from how software handles thresholds. Many systems define a “near plano” region of ±0.25 D. Within this zone, small fluctuations determine whether a meridian is labeled myopic or hyperopic.
I have seen firmware updates adjust this threshold to ±0.37 D, immediately reducing mixed astigmatism incidence without any hardware change. This alone should make engineers cautious about treating diagnostic categories as fixed properties.
Well-designed systems expose confidence metrics, standard deviation across captures, or repeatability scores. Poorly designed ones output a single number with no context.
Engineering Criteria That Actually Matter in Procurement
When evaluating diagnostic platforms, I recommend engineers and purchasing teams focus on parameters that directly influence mixed astigmatism reliability:
- Repeatability better than ±0.25 D across multiple captures
- Axis stability within ±3 degrees under normal fixation
- Active alignment guidance rather than passive chin rest positioning
- Accessible calibration routines with documented tolerances
In my experience, these factors matter far more than headline features such as measurement speed or AI branding.
Practical Engineering Limits
Even with optimal hardware, there is a lower bound to stability. Tear film breakup often occurs within 5–8 seconds, micro-saccades introduce angular deviations, and biological variability remains.
Engineers recognize this as an irreducible noise floor. Mixed astigmatism frequently occupies this boundary region, where the system is functioning correctly but cannot deliver absolute certainty.
Closing Perspective
From an engineering viewpoint, mixed astigmatism is best understood as a stress test for diagnostic systems. It exposes modeling assumptions, calibration quality, sensor limits, and software design choices.
Devices that are transparent about these constraints — and allow engineers to verify them — inspire far more confidence than those that promise perfect answers. Predictability, not absolute agreement, is the real indicator of engineering quality in refractive diagnostics.